How yards per play tells you who is winning comes down to one idea: the box score line most fans skip is a measure of efficiency, not a verdict. A team can win on raw yardage and lose the per-play battle, and a team can lose while clearly controlling the game. What the number does well is tell you who moved the chains, who was stopped, and how big the gap really was.
The math is trivial. The reading is not.
Table of Contents
- What Does Yards per Play Tell You About Winning?
- How Yards per Play Is Calculated
- How to Read Team Yards per Play
- How Yards per Play Reflects Winning Football
- When Yards per Play Does Not Tell the Whole Story
- How to Compare Yards per Play Across Games
- Frequently Asked Questions
- Conclusion: Start With Efficiency, Then Check the Context
What Does Yards per Play Tell You About Winning?
Yards per play divides a team’s total offensive yards by its total number of offensive plays, giving the average gain per play. Because the play count cancels out, it strips away pace and volume, which is exactly why two teams with identical yardage can look completely different on this stat.
So how yards per play tells you who is winning is really a question about differential. Neither team’s number means much alone. The gap between them is the signal: the team with the higher figure converted more of its snaps into meaningful gains, and that advantage compounds because efficient teams end drives closer to the end zone.
Even then, treat it as the first check rather than the answer. Turnovers, red zone execution and scoring efficiency routinely break the tie between two teams that ran nearly identical per-play numbers. A team that wins the toss and goes three-and-out twice in the red zone will lose to a team that ran the ball roughly as well but scored four touchdowns.
If you take one habit away from this, make it subtraction. Two raw figures side by side invite you to declare a winner prematurely. The gap tells you whether one team controlled the game or whether the score was a coin flip dressed up in yardage.
How Yards per Play Is Calculated
The formula is simple: total offensive yards divided by total offensive plays. The counting rules are where people go wrong, so here is how a standard box score breaks down.
| Line | Team A | Team B |
|---|---|---|
| Total plays | 78 | 72 |
| Total yards | 431 | 289 |
| Yards per play | 5.53 | 4.01 |
| Differential | 1.52 to Team A | |
Team A ran more plays, so the raw yardage gap looks much wider than the efficiency gap. Team A averaged 1.52 more yards per snap, which is a real advantage but not the blowout the yardage line implies. Run that example with two teams, and 431 against 289 reads like a rout while the per-play numbers say the margin was meaningful rather than historic.
A few counting conventions worth knowing:
- Every offensive snap counts, including incomplete passes, sacks, and plays that lose yards.
- Negative plays stay in the denominator. Excluding them quietly inflates the number.
- Sack yardage lost is subtracted from the numerator, and a sack still counts as a play.
- Turnovers are plays, so a fumble on a snap that would have been a gain enters the average as a loss or a short gain depending on the source. This is one reason net figures differ slightly from gross ones.
- Penalty plays with a repeat of down are not counted.
If you are working from a play-by-play sheet, verify the play count yourself. Forum users have reported published totals that do not survive a re-watch, and you cannot reproduce a number you cannot trust.
How to Read Team Yards per Play
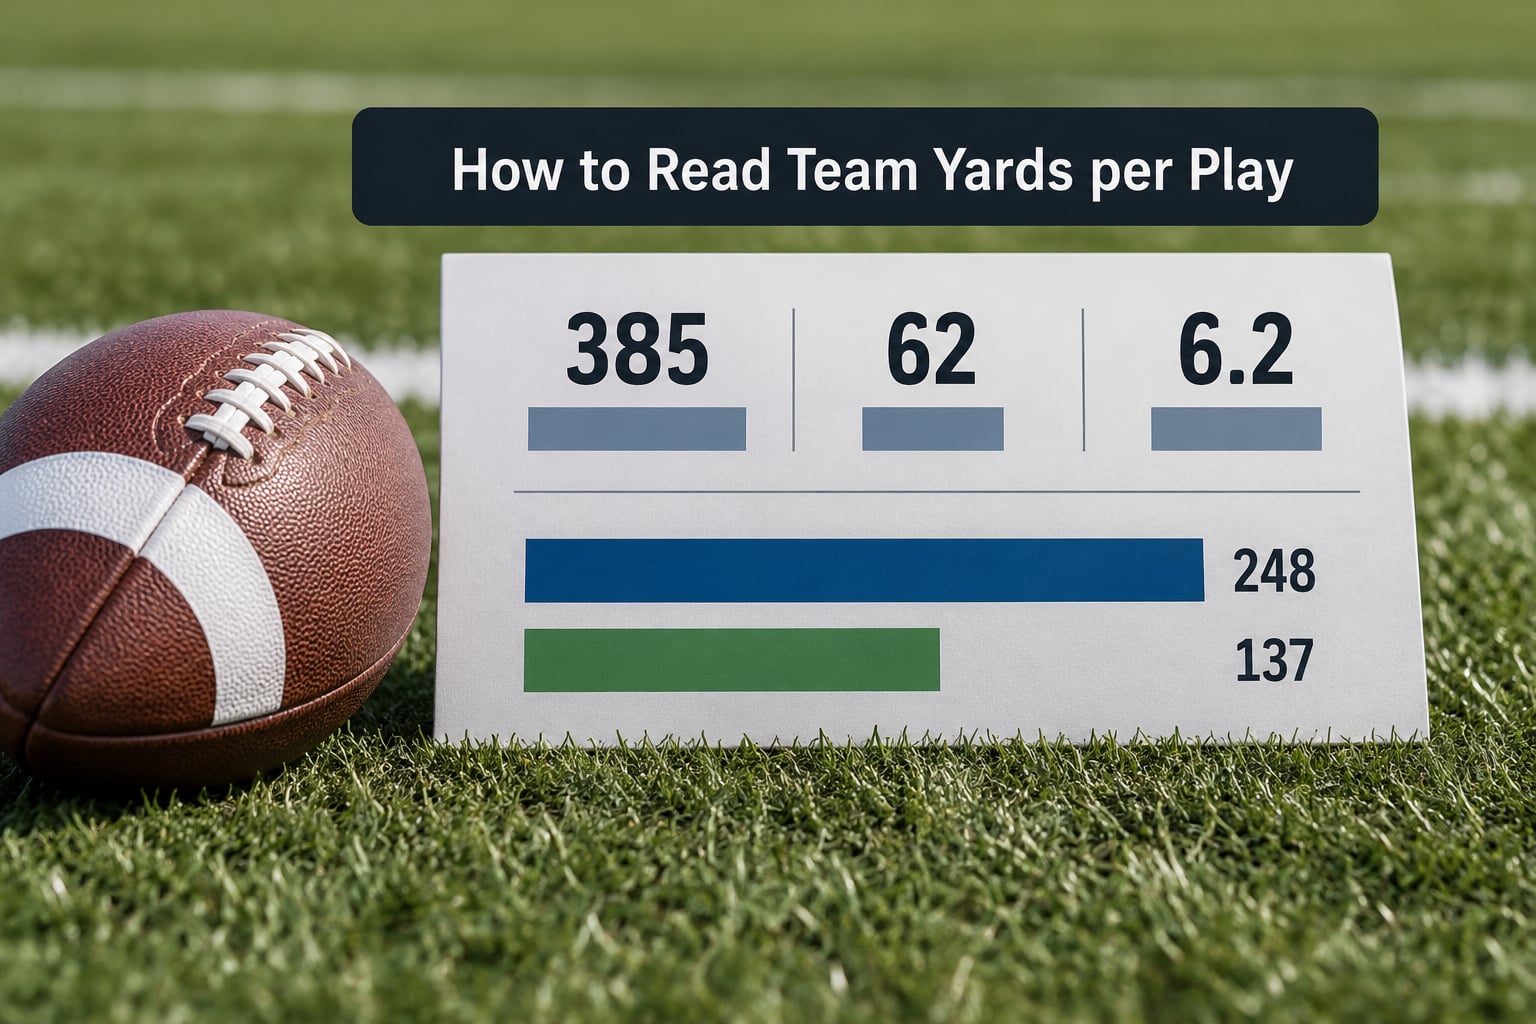
The all-plays number is a starting point, not a finished read. Break it apart before you commit to an opinion.
Split it into passing and rushing. A team can post a respectable 5.2 overall while its rushing is dead and its passing is carrying everything, or post 5.2 while both halves are solid. Those two teams deserve different expectations next week. Yards per pass play and yards per rush attempt tell you which.
Compare each half to the league average. This is the step most readers skip and the one r/nfl posters insist on. Raw yards per rush attempt rose across the league for years as pace and scheme spread grew, so a 4.2 figure meant something different last decade than it means now. Divide each team’s figure by the league average for that season and you get a relative number that survives a rule change.
Separate what you gained from what you allowed. Offensive YPP gained versus defensive YPP allowed tells you whether the gap came from your offense outplaying their defense, or their defense holding your offense down. A team can run the ball well all game and lose because its defense cannot stop anything.
Check the halves. First-half and second-half figures split fast. A team that gains 6.4 per play in the first half and 3.9 in the second has either adjusted or run out of gas, and one of those is a much better story than the combined number.
What Situation Context Changes the Meaning?
Per-play efficiency is a raw number until you attach the situation to it. Down and distance drive most of it: a team facing third and twenty will post a passing figure well below its average, and a team facing second and one will post a rushing figure well above it. Blending those together describes nobody.
Scoreboard and clock matter too. The same 4.8 yardage per play is a different story when it comes in the first quarter against a team that has not scored yet than when it arrives in the fourth with the game decided. Field position is the other half of the equation, because a five-yard gain from the 30 is a completely different asset than a five-yard gain from the 5.
Finally, opponent quality. A 6.1 yardage per play against a rebuilding defense is worth less information than a 5.2 against a ranked front. Sample size limits apply hard here too: one 60-yard run inflates a team’s yards per carry in ways that have nothing to do with how good the offense is.
How Yards per Play Reflects Winning Football
Efficiency wins games through a chain rather than a single number. Sustained per-play gains produce first downs, first downs produce field position, field position shortens the path to the end zone, and shorter paths raise scoring rates.
Think about a team averaging 6.0 yards per play against one averaging 4.5. Across a drive of eight plays, that difference is roughly a first down and a half. Over three or four drives, it is the difference between starting drives near midfield and starting them on the goal line, which is most of what decides a 24-17 game.
Here is the practical read from a box score. A leading team that out-gains its opponent on total yards but trails on yards per play has been helped by extra snaps, which usually means turnovers or extended drives. A trailing team that wins the per-play battle but loses the yardage battle had the more productive offense and still lost, usually because turnovers or red zone failures cost more than efficiency could replace.
That is the honest answer to who is winning. Per-play advantage tells you which team is playing better football. The box score’s other four lines tell you why the score looks the way it does, and both of those things are true at the same time.
When Yards per Play Does Not Tell the Whole Story
Every version of this number has a failure mode, and experienced readers tend to distrust a stat once they know where it breaks. These are the ones that actually cause bad reads.
- One explosive play. A single 70-yard touchdown and a 40-yard scramble can produce an elite per-play figure for a stalled offense. Success rate exists specifically to prevent that masking.
- Garbage time. Trailing teams pass constantly in the fourth quarter against prevent coverage, and trailing teams are usually playing their backups. The final figure gets pulled down by substitution and pulled around by air yards.
- Kneel-downs and short-yardage scripting. Once the outcome is settled, teams run the clock out with plays designed to lose one yard. Those snaps drag a team’s number down without saying anything about its offense.
- Blowout substitution. Deep in a lopsided game, the roster you are evaluating is not the roster that started.
- Pace inflation. Total yards and yards per game reward tempo offenses for running more plays. Per-play removes pace but adds nothing about how those plays were distributed in field position.
- Low volume. A 6.0 figure off 40 plays is a much smaller sample than 5.4 off 90. Sample size is not a formality in college football, where drive counts run low.
- A weak opponent. Raw per-play numbers move with the schedule. Comparing teams who never shared a common opponent is comparing two different tests.
The pattern across all seven is the same. The stat measures what happened on the snaps, and almost nothing about where those snaps started, how many were left, or who was still on the field.
How to Compare Yards per Play Across Games
A fair comparison takes a few deliberate steps. Look at multi-week averages rather than a single game, since one outlier play distorts a short window badly. Compare teams only against shared opponents, because that is the closest thing to a controlled test available without a model. Check the passing and rushing splits against season averages instead of absolute yardage. Then read the differential and pair it with turnover margin, red zone efficiency and third-down conversion rate before you say anything about the winner.
YPP also sits inside a family of metrics that each answer a slightly different question. Here is how the main ones divide up.
| Metric | What it measures | Use it for |
|---|---|---|
| Yards per play | Average net gain per snap | The fastest first check |
| Yards per attempt | Air efficiency, net of sacks and turnovers | Evaluating a quarterback |
| Success rate | Share of plays gaining enough to keep the drive alive | Catching explosive-play masking |
| EPA per play | Average change in expected points value | Weighting plays by context |
| DVOA | Success relative to what the opponent usually allows | Ranking across a season |
The critic’s version of this argument is that yards per play is meaningless because it ignores down, distance and field position. The rebuttal is that it is not trying to be a final answer. It is the cheapest way to discard a team that got outplayed, and it gets you to the more useful metrics with no math. For a quick post-game read, the sequence that works is differential first, then success rate, then EPA or DVOA once you want context weighting.
For data, college games and box scores are the natural starting points, with play-by-play columns available on both. Expected points, success rate and win probability added are the context layer most readers eventually graduate to.
Frequently Asked Questions
What is a good yards per play in the NFL?
A good yards per play is roughly in line with the league average for that season, which usually sits in the mid-5s overall, with passing around 7 and rushing around 4.3. But the average moves as pace and scheme spread change, so the real answer is relative. A team above its league average on both splits is performing well regardless of the absolute number.
Does yards per play tell you who won the game?
It tells you who played better, not who won. Efficiency drives field position and scoring chances, so the team with the higher per-play figure usually has the better chance. Turnovers, red zone execution and scoring efficiency decide a large share of close games, which means a team can win the per-play battle and still lose the box score.
Why split yards per play into passing and rushing?
Because the two halves carry different information. A team averaging 5.6 overall might have elite passing and poor rushing, or the reverse, and those profiles behave differently against different opponents. Most readers in r/nfl and r/NFLstatheads divide each half by the league average, so you are comparing relative performance rather than raw numbers that shift year to year.
Why do teams win with fewer total yards?
Usually turnovers, field position or red zone trouble. Total yards reward pace and play count, so a team that runs more snaps can out-gain an opponent that was more efficient on every snap. A fumble at the goal line or a pair of three-and-outs inside the twenty costs more than a per-play advantage can replace.
Is yards per play predictive of the winner?
Directionally, yes, and more so as a differential than as two separate numbers. But no single efficiency metric settles a game, and every reliable model weights down, distance and field position that yards per play ignores. Treat a wide gap as strong evidence and a narrow gap as a coin flip.
Can you compare college and NFL yards per play?
Not directly. College offenses run more plays, use more motion and spread the field differently, and play on a slightly larger field, which pushes college per-play figures higher across the board. Compare conference to conference or use relative figures divided by league or conference average rather than putting a raw number from each level side by side.
Conclusion: Start With Efficiency, Then Check the Context
Yards per play tells you which team moved the chains more efficiently, and the differential between the two figures is the fastest honest read on who played better football. It does not hand you a winner, because it ignores field position, turnovers and scoring efficiency.
So start there, then check success rate, turnover margin and red zone efficiency before you call the game. If the per-play gap is wide, you likely have your answer already. If it is narrow, go look elsewhere, because the number is telling you the teams were about even.