How home court advantage works in college basketball comes down to a handful of small, measurable conditions that all push the same direction: a familiar building, an officiating crew that tilts slightly in the home team’s direction, a road trip that eats energy, and a crowd that makes communication harder for the visitors. Across Division I conference games, home teams win roughly 59 to 64 percent of the time and outscore visitors by about 3 points per game. That is an edge, not a guarantee.
It is also an edge that has shrunk over the decades, which surprises people who still expect a fortress. Below is what the data actually shows, which mechanisms have real evidence behind them, and why a mid-major squad with a hostile floor will still beat a ranked power program more often than it should.
Table of Contents
- What Home Court Advantage Is
- How Home Court Advantage Works in College Basketball
- How Fans, Student Sections, and Loud Crowds Help
- The Venue, Schedule, Travel, and Referee Factors
- How Researchers Measure the Home-Court Edge
- What Is the Average Home-Court Advantage in College Basketball?
- Why Home-Court Advantage Does Not Guarantee a Win
- How Teams Can Use or Limit Home-Court Advantage
- Frequently Asked Questions
- How much does home court advantage usually matter in college basketball?
- Does a loud crowd really cause visiting teams to miss more shots?
- Why do some teams seem to play better at home than others?
- Is home-court advantage larger in conference tournaments?
- Do referees create the home-court advantage?
- Can a visiting team overcome home-court advantage?
- Conclusion
What Home Court Advantage Is
Home court advantage is the measurable edge a team gets when it plays on its own campus rather than on the road. It shows up as a higher win rate and a larger scoring margin for home teams than for those same teams playing away.
Two things are worth separating right away. First, home court is a property of a game, not a prophecy. It shifts the odds; it does not decide the result. A 4-point edge on a game decided by 3 is nothing, and the same 4-point edge against a 20-point favorite is noise.
Second, home court is not the same thing as crowd noise. Fans are the loudest, most visible part of it, but the largest documented channel is usually the whistle. If you only count the noise, you will badly underestimate how the advantage is actually produced.
So when people say a team has home court advantage in college basketball, they are describing a measurable pattern, not a feeling. The useful question is how big the edge is on this night, in this building, against this opponent.
How Home Court Advantage Works in College Basketball
The mechanisms are best understood as a list, because they stack. Ranked by how well the evidence supports them:
- Officiating. Home teams get fewer fouls called on them, get to the line more often, and see their bonus free throws. This is the single most consistent channel in the box score data.
- Crowd noise and visual pressure. Loud environments disrupt communication and add psychological weight, particularly for visiting shooters and free throw shooters.
- Travel and schedule density. A road trip that starts the morning after a game costs more than a bus ride suggests, and conference schedules are not always balanced.
- Arena, routine and crew familiarity. The same floor, the same basket, the same warm-up routine, and often the same officiating crew your team has seen all season.
- Emotional response. Playing in front of the people who care most produces a different emotional register, for better and occasionally for much worse.
- Schedule context. Home games sometimes come against rested opponents while road games pile onto a back half of the schedule.
Each channel is worth a fraction of the total. Add them up and you land in the neighborhood of 2 to 4 points per game in the adjustment models that bettors and bracket predictors use, which is a shorthand for the whole package rather than a measurement of any one of them.
Why Home and Away Games Can Produce Different Results
Repeated exposure to a venue does real work. Players learn where the light catches, how the floor sounds under a running crowd, how far the seats are from the sideline, and which side the scorer’s table sits on. That familiarity shows up in spatial awareness, in timing on a drive into traffic, and in how quickly a guard finds an outlet when a screen gets covered.
Communication is the quieter benefit. Calls, “help,” and defensive rotations are partly spoken and partly gestured, and a team that has read the same noise pattern a hundred times can communicate through it more efficiently than a team hearing that noise for the first time.
The flip side is real too. Familiarity can tighten a team up, but it can also tighten them into a bad habit. A home crowd that has watched the same 12 sets 14 times knows the tendencies of its own team, and so does the visiting team, which has film on all of it.
How Fans, Student Sections, and Loud Crowds Help
Crowd noise helps in three measurable ways: it degrades communication for the visiting team, it adds emotional pressure to a visiting shooter’s release, and it raises the temperature in a way that helps the home side stay loose.
Program-level evidence for that is easy to find. Boise State’s student section, the Corral, reorganized its ambassador board and designated seating, and the program followed with roughly 21 percent attendance growth to an average crowd near 12,208, three crowds above 12,000, and an unbeaten conference home season. The atmosphere did not win those games by itself, but attendance and home results rose together.
The cleanest test of the crowd channel came in the 2020-21 season, when pandemic rules emptied arenas. The Big Ten went 44-28 at home, about 61 percent, in a season with no student sections at all. That is a smaller drop than many people predicted, which is the strongest hint that noise is a contributor rather than the whole engine.
Where the loud-crowd story gets overstated: crowd size and crowd intensity are not the same variable. A building can be packed and quiet through the first 20 minutes of a game that matters. The fans who change a road trip are the organized ones, the ones who stand through dead balls, and the ones who keep going after the opponent has made a run.
The Venue, Schedule, Travel, and Referee Factors
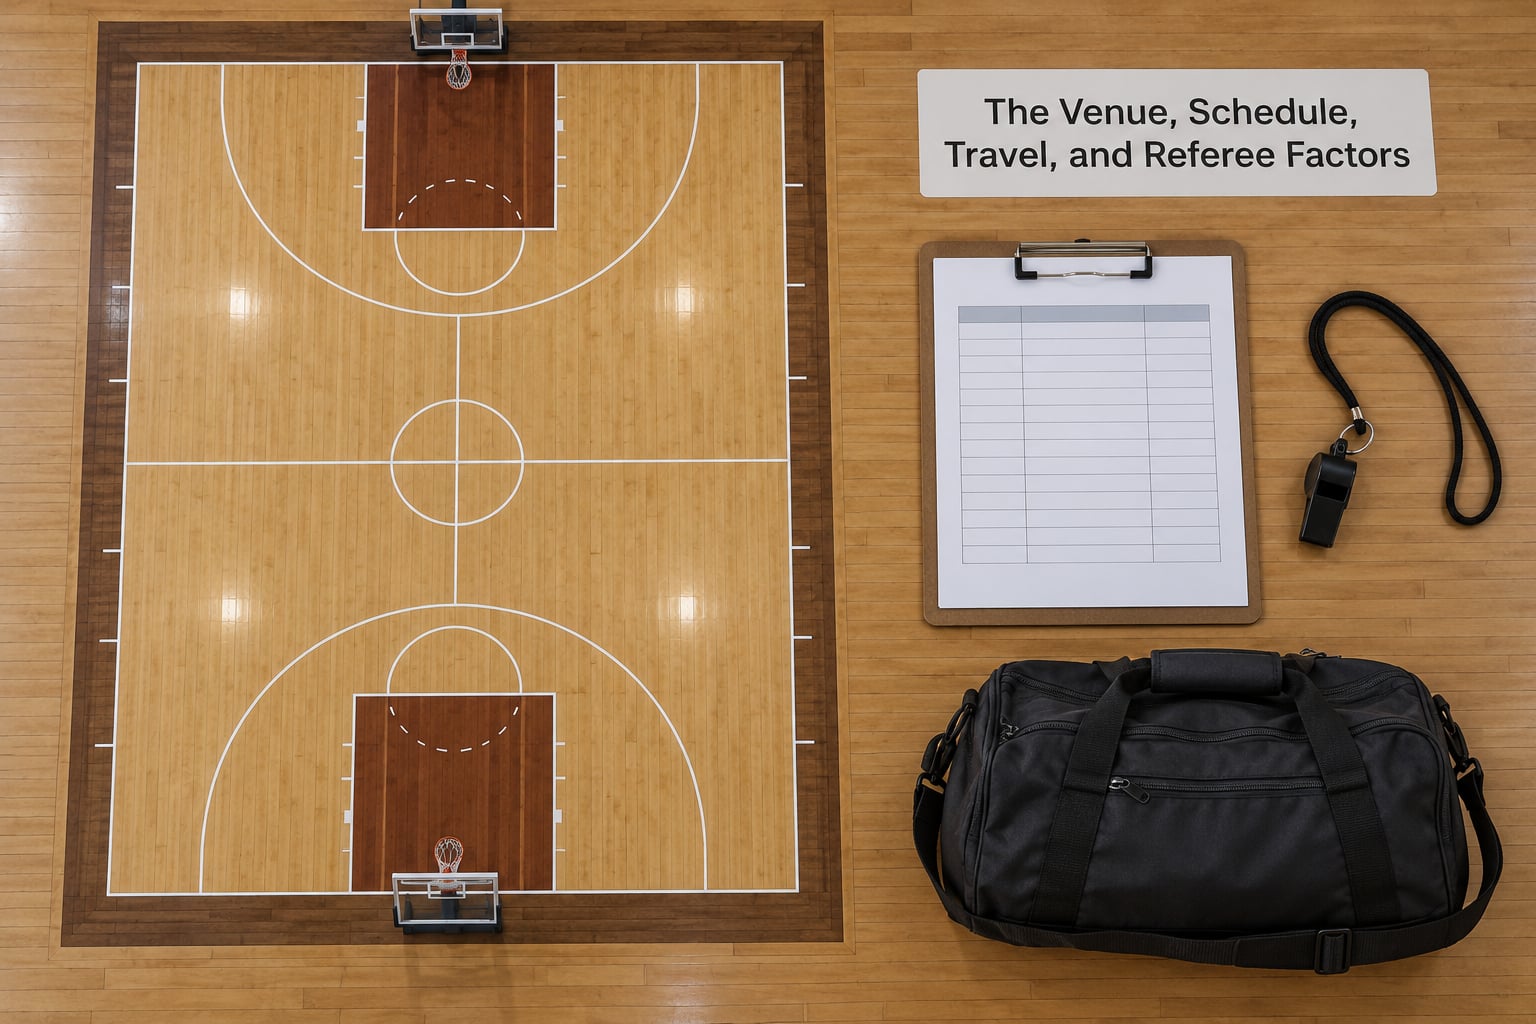
Not all home floors are equal. Arena capacity changes the ceiling on how loud a place can get, but layout matters just as much: a building with a low roof over the baseline feels different from one where the crowd sits in a bowl behind the hoop. Lighting, court dimensions within regulation tolerance, and the placement of the scorer’s table all feed into the same routine a team runs every night.
Officiating is the mechanism most fans underrate. Home foul margin is the stat to look at: the gap in fouls called between the home and away teams. When that margin runs consistently in one direction across thousands of games, it is hard to attribute the gap to noise or travel. It is also the mechanism most contested, because unconscious bias and home-team favoritism are genuinely debated in the officiating community itself.
Travel gets dismissed too quickly. The ride might be comfortable, but it still requires a hotel night, an unfamiliar shooting gym, a different sleep pattern, and time zones that get worse the further a conference stretches after realignment. Forum discussion often lands on the same point from both directions: fans credit the building for wins, then blame the building for losses, and neither version explains the underlying distribution.
How Researchers Measure the Home-Court Edge
Researchers measure the edge by pretending home teams are supposed to win, then checking whether they do. If the raw home win rate were 50 percent, a home floor would be worth nothing. Every point above that is the edge.
Here are the indicators, and what each one tells you:
| Indicator | What it shows | Why it can mislead |
|---|---|---|
| Home win percentage | Share of games won at home | Blends in team strength, because good teams play more home games against weaker opponents |
| Home scoring margin | Points scored at home minus points allowed at home | Drifts with the scoring environment across decades, so era adjustment matters |
| Home foul margin | Fouls called against home minus away | The cleanest read on the officiating channel, and the one fans look up least |
| Adjusted efficiency margin | Points scored versus allowed per possession, adjusted for opponent | The best team-quality measure; home correction is added on top of it |
| Free throw rate split | Home free throws versus away free throws | Directly connected to the foul margin, so it is not an independent measure |
| Turnover and shooting splits | Home turnovers and shooting versus away | Noisy at small sample sizes and easy to cherry-pick |
Because raw home win rate is inflated by schedule structure, serious models correct for opponent quality first and then apply a separate home adjustment, usually in the 2 to 4 point range. Pomeroy-style efficiency ratings are the standard version of that, and bracket sites copy the adjustment when they set spreads.
Home rates also differ by level and by sport, which is the fastest way to see how much of the edge is schedule structure rather than psychology:
| Level | Typical home win rate | Typical margin |
|---|---|---|
| NCAA Division I men’s conference play | About 59 to 64 percent | Roughly 3 points per game |
| NCAA women’s basketball | Comparable pattern, reported across all divisions | Studied less often than the men’s game |
| NCAA Division II and III | Home teams performed better across nearly all box score statistics | Tighter margins, less travel, similar direction |
| NBA | About 65 percent | Larger than college basketball |
| NFL | About 60 percent | Smaller than the NBA, larger than a neutral site |
Historical context matters as much as the current number. Home win percentage bottomed out near .597 in 1962, peaked around .720 in the early 2000s, and fell to roughly .590 in 2017, an all-time low. Every explanation for the decline has been proposed, and every one of them has counter-evidence: television scrutiny of officials, improved charter travel, conference realignment, declining crowd sizes, and a general rise in offense that compresses margins.
Notice that the decline kept happening after the explanations started. That is worth holding onto when anyone tells you a single change caused it.
What Is the Average Home-Court Advantage in College Basketball?
There is no permanent universal number, and any single figure you see quoted is a snapshot of a season, a division, or a data source. A number stated without its scope is not useful.
Two different quantities also get confused constantly. The raw home winning percentage answers “how often do home teams win?” The margin in points answers “how much bigger does the home team look?” They do not move together. A conference can win 62 percent of its home games while being outscored by roughly 3 points a game at home, because a few blowouts skew the margin far more than the win rate.
So if you want the practical number: home teams win roughly 59 to 64 percent of Division I conference games, and the models that price the advantage in points use something around 2 to 4. Treat both as a range for the average game, not a prediction for the one you are watching.
Why Home-Court Advantage Does Not Guarantee a Win
Strong road teams exist, and they beat good programs at their home gyms most weeks. Talent gaps do most of the work in the games that get remembered, and the home edge is a rounding error next to a real difference in talent.
Other ways the edge shrinks or reverses: inexperienced teams playing their first home game of a season, injured or suspended starters, an officiating crew that is not the one the team sees most often, and a visitor that has a specific plan for silencing a crowd.
Small samples cause the most confusion. One upset in March does not disprove a season-long pattern, and one blowout home win does not prove a building is special. Playoff series data gets quoted constantly and rarely comes with context: in one widely shared NBA thread covering 1999 to 2008, home teams won 81.3 percent of first-round series and 80 percent of conference semifinals but only 50 percent of conference finals. Series-level rates swing harder than game-level ones because there are fewer of them.
And in the NCAA Tournament, most games are played at neutral sites, which removes the crowd channel almost entirely while keeping venue familiarity for the host region. That is why tournament results often look flatter than the regular season, and why a top seed is difficult to pick against for reasons that have nothing to do with the building.
How Teams Can Use or Limit Home-Court Advantage
For the home team, the goal is to make the environment automatic. Players practice the noise, so the real thing registers as familiar rather than strange. They use the same arena routine on every home date, from warm-up music to the walkout, because repetition is what converts an advantage into a default.
Coaches who want the building to help them watch how the visiting team handles it. If a guard stops calling switches out loud, the crowd is doing its job. If a team settles into a rhythm early, the floor is neutralized, and the coach has to create back-to-back possessions where nothing is settled.
For the road team, communication comes first. Hand signals and eye contact replace most of the calling. Teams that travel well treat the trip as a controlled routine rather than an interruption, and they schedule shooting before they are tired, not after.
Scouting a hostile environment is more useful than pep talks. Watch film of how the crowd sounds and where it stands, then walk the arena early, shoot in it, and get a normal number of possessions there before tipoff. Bring the noise back in practice, either with loud playback or by cranking the arena volume during shootarounds, so the ears have already adapted.
For fans, the practical items are unglamorous: arrive early, stand during dead balls, and stay for the whole game. A student section that sits for the first half and cheers for the last five minutes has not built a home floor, it has built a fourth quarter.
Frequently Asked Questions
How much does home court advantage usually matter in college basketball?
Home teams win roughly 59 to 64 percent of Division I conference games and outscore visitors by about 3 points per game on average. Models used by bettors and bracket predictors convert that edge into a home adjustment of around 2 to 4 points. Treat it as a shift in odds for the average game, not a guarantee for any single game.
Does a loud crowd really cause visiting teams to miss more shots?
Crowd noise has a plausible but modest effect, mostly through broken communication and added pressure on shooters and free throw shooters. The clearest evidence is that home teams got more free throws and were called for fewer fouls at home, which points to officiating rather than noise. Empty arenas in 2020-21 barely moved home win rates, which weakens the loud-crowd explanation.
Why do some teams seem to play better at home than others?
Because the size of the edge varies by team, arena, conference and schedule. A program with an organized student section, a building tuned for noise, and low travel in conference play banks more of its home games than a team playing an unbalanced slate with long road trips and soft arena crowds. Opponent quality also matters, since home win rate flatters whoever faces weaker teams at home.
Is home-court advantage larger in conference tournaments?
Postseason tournaments vary. Single-site conference tournaments played on one campus restore the crowd and venue channels for the host school, which is why a top seed often holds serve. Games moved to a neutral site, including most NCAA Tournament games beyond the first rounds, strip out much of the advantage because neither team has a real home floor.
Do referees create the home-court advantage?
Officials are the largest documented channel, measured by home foul margin and the resulting gap in free throws. Whether that margin comes from conscious bias or unconscious home-team preference is still argued inside the officiating community. Whatever the cause, the gap shows up consistently in the box score across thousands of games, which is why the honest answer is that referees are part of the advantage rather than all of it.
Can a visiting team overcome home-court advantage?
Regularly. Road teams with efficient shooting, low turnover and good ball movement erase a 2 to 4 point edge without needing anything dramatic. Quality teams win at hostile gyms most weeks, and tournament games at neutral sites strip the crowd channel out entirely. What usually causes road losses is not the building on its own but a talent gap plus the building.
Conclusion
Home court advantage in college basketball is not one force. It is a foul margin, a noise level, a travel burden, an arena routine and a schedule, each contributing a fraction of a few points and each varying by team, building and season.
So start with the matchup and the venue, not the crowd. Check who is actually at home, how far the road team traveled, whether the officials are familiar ones, and what the point spread already assumes. Everything else is atmosphere on top of that.