
A basketball box score is the official statistical record of one game: every player’s points, shooting, rebounds, assists, steals, blocks, turnovers, fouls and plus/minus, plus each team’s totals. Statisticians log every possession courtside as the game happens, and that log gets published online within minutes.
Once you know what to do with those columns, a box score becomes the fastest way to understand a game you watched, a game you missed, or a game your team lost in a way the score alone never explains. Here is how to read a basketball box score, in the order that actually works.
Table of Contents
- What You Need to Read a Basketball Box Score
- Step-by-Step: How to Read a Basketball Box Score in 7 Steps
- Common Mistakes
- Frequently Asked Questions
- What does FG mean in a basketball box score?
- Why are field goals shown as 5-11 instead of 11 points?
- What is the difference between offensive and defensive rebounds?
- How do I know which player had the best performance?
- Should I compare box scores from different basketball games?
- What does the plus-minus statistic tell me?
- Conclusion
What You Need to Read a Basketball Box Score
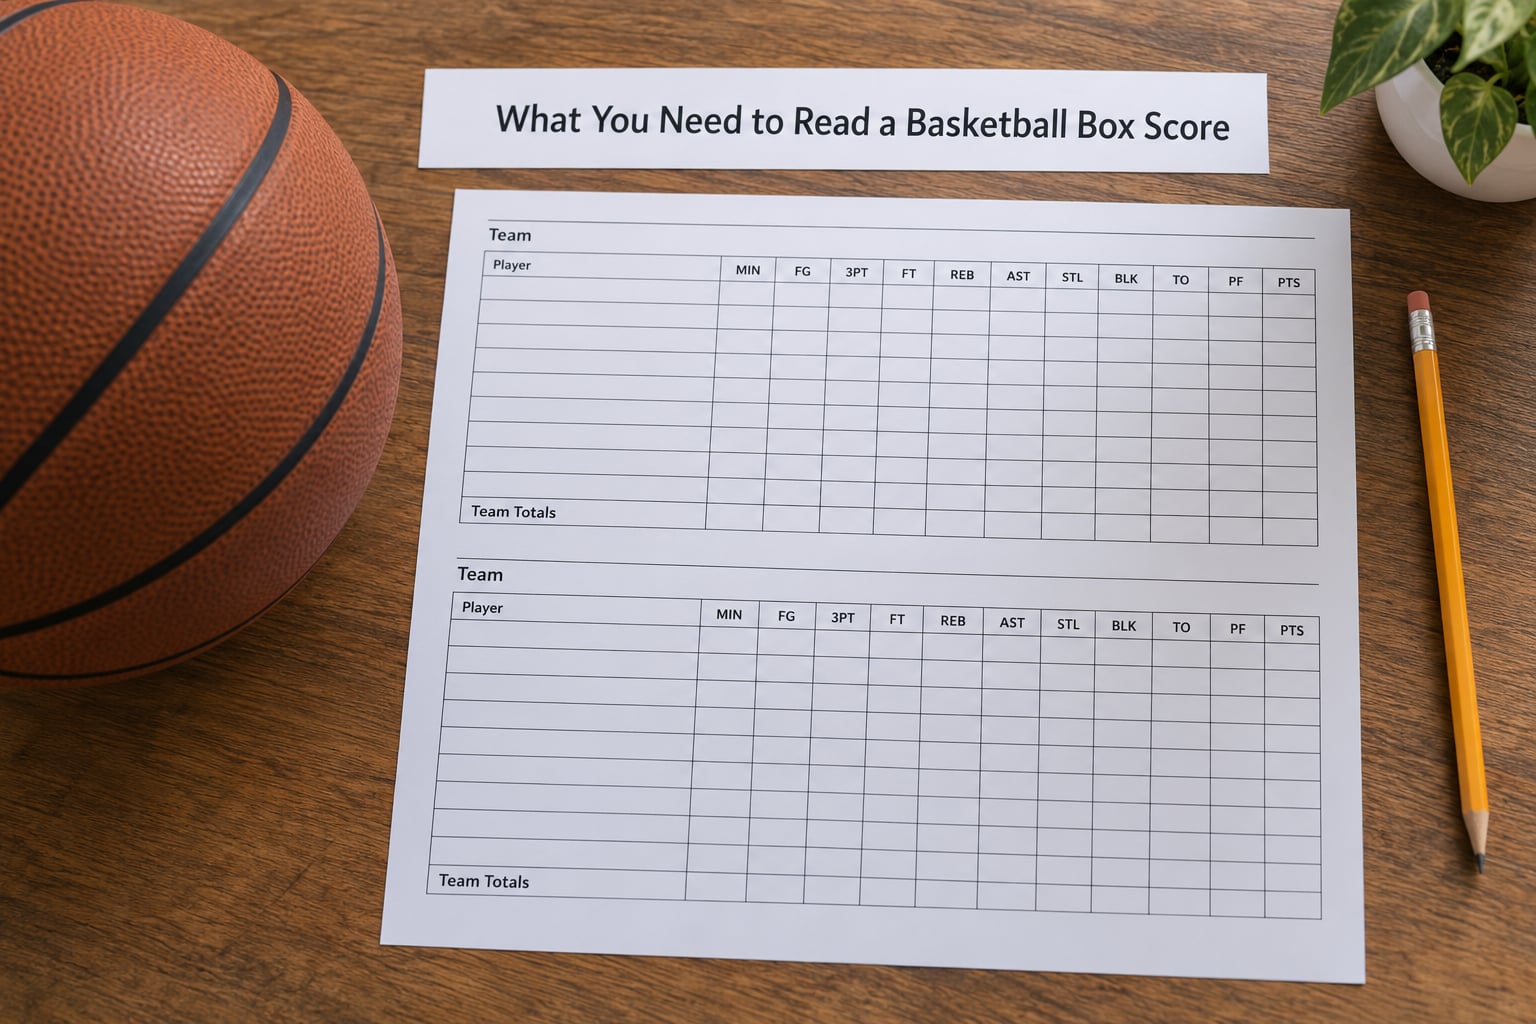
You need almost nothing. A printed score sheet, a browser, or the stats screen on your phone will do, and roughly ten minutes the first time. It helps to know the basic rules of basketball: three points for a made three-pointer, two for anything inside the arc, one for a free throw.
Every box score, on any site, has the same four blocks.
- The header, with the final score, the score by quarter, and each team’s record.
- The player table, with one row per player who played, starters first.
- The team totals row, which is the single most important line and the one most fans skip.
- The team stats footer: points in the paint, second chance points, fast break points, biggest lead, and times the lead changed or was tied.
That footer is where you find out why a team won rather than just that it did. More on that in a moment.
Step-by-Step: How to Read a Basketball Box Score in 7 Steps
Start With the Score and Team Summary
The header tells you the shape of the game before any player gets credit. A team up 20 at the end did not necessarily control anything for 40 minutes, and the quarter-by-quarter line is where you find that out.
The number in parentheses next to a team name is that team’s record. If you see “Lakers (40-25)” on a broadcast graphic, that is wins and losses, not something about the game you just watched. It confuses almost every new fan, and the Reddit threads about it are never-ending.
Blank cells and small codes also have meanings. DNP means did not play, DNTR means did not enter the rotation, and DQ means disqualified. None of them are a judgment about the player; they just mean there is no stat line to read.
As for where to find the thing itself: ESPN is the fastest and cleanest for casual reading, NBA.com/Stats has the deepest filters, and Basketball-Reference is what fans use for history and single-game records. All three show the same game with slightly different columns, which is normal.
Understand the Main Player Statistics
Here is the glossary with the interpretation attached, which is the part most guides leave out. The “what good looks like” column assumes a college or professional rotation, where a player touches the ball a meaningful share of the time.
| Stat | Full name | What it counts | What good looks like |
|---|---|---|---|
| MIN | Minutes played | Time on the court | Matches your role: 30+ for a starter, 10-15 for a bench player |
| FGM | Field goals made | Shots that went in, twos and threes combined | Reads alongside FGA, never alone |
| FGA | Field goals attempted | Every shot taken, including misses | 20+ for a primary scorer, 5 or fewer for a paint-only big |
| FG% | Field goal percentage | FGM divided by FGA | Around 45-50% |
| 3PM / 3PA / 3P% | Three-pointers made, attempted, percentage | Long-range shooting, split out | 35%+ for a volume shooter |
| FTM / FTA / FT% | Free throws made, attempted, percentage | Uncontested scoring from the line | 75%+ overall, 85%+ after a shooting foul |
| OREB | Offensive rebounds | Boards on a miss by your own team | Any extra possession matters |
| DREB | Defensive rebounds | Boards on a miss by the other team | 7-10 for a starting center |
| REB | Rebounds | OREB plus DREB | Look at the split, not the total |
| AST | Assists | Passes that lead directly to a made basket | 5-8 for a lead guard |
| STL | Steals | Taking the ball away cleanly | 1-2 without gambling |
| BLK | Blocked shots | Swatting a shot out of bounds | 2+ for a rim protector |
| TOV | Turnovers | Possessions lost, including shooting fouls and violations | Under 3 per 36 minutes |
| PF | Personal fouls | Fouls called against that player, team fouls over the limit put a player on the line | Foul trouble shows in the points-in-the-paint column |
| PTS | Points scored | Twos, threes and free throws added up | Meaningless without the shooting line next to it |
| +/- | Plus/minus | Net points scored while that player was on the court | Anywhere from -8 to +8 in an ordinary game |
Two details catch people out. An assist requires the pass to lead directly to a made basket with no intervening pass, so team assist totals always run lower than the number of baskets scored. And a turnover counts a shooting foul as a turnover and a field goal attempt, which is why a bad foul can inflate someone’s shot percentage.
Points are just arithmetic: two made field goals and one made free throw is written 2 – 2 – 0 in some older formats, for a total of five. A stat line reading 18 points off 6-of-11 shooting with 4 threes works out the same way.
Read Shooting Percentages in Context
FG% is just FGM divided by FGA, so 6 made on 11 attempts is 54.5%. That number looks great until you notice it came on 11 attempts instead of the 20 the player normally gets. Percentage without volume tells you almost nothing.
The three splits tell you what kind of shooter you are looking at. A player going 5-of-6 with four threes was efficient in a small, high-percentage window. A player going 8-of-22 with three threes had a bad night, even though his raw points might look similar.
Use the splits to describe shot profile, not just quality. High 3PA with a low 3P% means the player is living above the break and being paid for the misses in spacing. High FTA with a high FT% means the team is feeding him through contact.
Compare Individual and Team Performance
Now read the team totals row under the player lines, then the team stats footer. Points in the paint tell you who won inside, second chance points tell you how much the offensive glass mattered, and fast break points tell you who played defense badly in transition. Biggest lead and times lead changed explain a close game that ended lopsided.
Turnovers deserve more weight than most fans give them. Every turnover is a possession handed over with nothing to show for it, and it is the fastest way for a good-looking stat line to belong to a losing team.
Plus/minus is the most misunderstood column and the most useful one. It is the net change in the score while that player was on the court, not the player’s own scoring.
Worked example: a guard’s team is up 88-84. He checks in and the team outscores opponents by 9 points during his 22 minutes. That is +9. He could have scored 4 points himself and still posted +9, because plus/minus measures his teammates too. The same guard coming off the bench with the team outscored by 11 posts -11 on a night where he personally played fine.
Once counting stats make sense, the advanced layer is worth about four more numbers. Effective field goal percentage (eFG%) credits a three for what it is worth. True shooting percentage (TS%) adds free throws into the same efficiency measure. Offensive and defensive rating (ORtg, DRtg) are points scored and allowed per 100 possessions. Usage rate (USG%) is the share of team possessions a player ends. PIE is a single number blending every category into one impact figure.
One possession, for context, is one shot plus everything that follows: an offensive rebound means the same possession continues. That is why per-game totals flatter fast teams and why the per-100 numbers exist.
Common Mistakes
Treating the highest scorer as the best player. Points are a function of opportunity. A guard who took 25 shots because his team trailed all night has a bigger number and usually a worse plus/minus than the player who made 6-of-7.
Ignoring turnovers. Read the TOV column before you read anything else in that row. Ten turnovers erase the value of nearly any shooting line.
Reading FGM as points. Six made field goals is not six points. Three of those six might be threes, which puts the total at 15 instead of 12.
Comparing raw totals across teams. A fast team plays more possessions than a deliberate one, so every raw number on their box score runs higher. The per-100 numbers are the fair comparison.
Assuming every rebound is defensive. DREB ends a possession. OREB creates one. Two offensive boards can be worth more than three defensive ones.
Believing a big block total means a great game. Shot blocking is a selection effect as much as a skill: a defender has to be near the rim and take the risk of going behind a shooter. Ten blocks off 22 attempts is a different story from three blocks off three attempts.
Skipping the minutes. MIN tells you opportunity, not performance. Any rate comparison between a 38-minute starter and an 8-minute bench player needs adjusting in your head.
Calling a strong counting line a good game without the score. A fantasy-style stat line of 30 points, 8 rebounds and 7 assists can belong to a team that lost by 12 because of ten turnovers.
Frequently Asked Questions
What does FG mean in a basketball box score?
FG stands for field goal, a shot taken from inside or outside the three-point line. FGM is field goals made, FGA is field goals attempted, and FG% is the first number divided by the second. A line showing 6-11 means six shots went in out of eleven taken, a 54.5% night.
Why are field goals shown as 5-11 instead of 11 points?
Because those are shots, not points. Field goals made and attempted are counted together, so 5-11 means five made shots out of eleven attempts. To get the score you multiply: each make is worth 2 points, or 3 if it came from beyond the arc, and you add the free throws on top.
What is the difference between offensive and defensive rebounds?
An offensive rebound (OREB) is a player securing a missed shot by his own team, which keeps the same possession alive. A defensive rebound (DREB) ends the opponent’s possession. REB is simply the two added together, and reading only that total hides which kind of rebounding a player actually does.
How do I know which player had the best performance?
There is no single column that decides it, and that is the honest answer. Look at the shooting line with its attempt totals, then turnovers, then plus/minus, and finally the context of the team totals and final score. A player on the winning team with a positive plus/minus and few turnovers usually had the stronger night.
Should I compare box scores from different basketball games?
Compare them carefully. Raw totals favor faster teams that play more possessions, and different opponents produce different shooting numbers. Per-100 possessions and percentage stats transfer between games far better than counting totals do. Comparing a player against himself across games is usually more informative than comparing him to someone in another game.
What does the plus-minus statistic tell me?
Plus/minus is the net change in the score while a player was on the court, including his teammates’ production. A plus/minus of +9 means his team outscored opponents by 9 during his minutes, not that he scored 9 extra points. It is the closest thing a basic box score has to an impact number, and its main limit is that it ignores which teammate was on the floor.
Conclusion
Start with the team totals, then work down to the individual lines: minutes, shooting splits with their attempt counts, rebounds by type, assists and turnovers, and finally plus/minus for context on the game itself. Points come last because they are the number people already quote and the one that tells you least on its own.
Open the box score from last night’s game and check the team stats footer. Once you know where points in the paint and second chance points sit, you will find you can explain a result you watched without anyone having to tell you what happened.