Learning how to read a football box score takes about ten minutes once you know the order to read things in. Start at the top with the score by quarters, move down to team totals and individual statistics, then finish with the drive chart and participation report, and that sequence will tell you who won and how. This guide is about American football, college or pro, not soccer, even though search results for this question keep sending people to squares pools.
A box score looks like a wall of numbers the first time you open one. It is not. It is the same eight sections in the same order every time, and once you know what each section is for, the wall turns into a story about the game.
Table of Contents
What You Need
You need the box score itself. That is the whole tool list. You can find one on the athletics site of either school under the game page, on the league or conference site, or on a stats archive like Pro Football Reference for older games and player season lines.
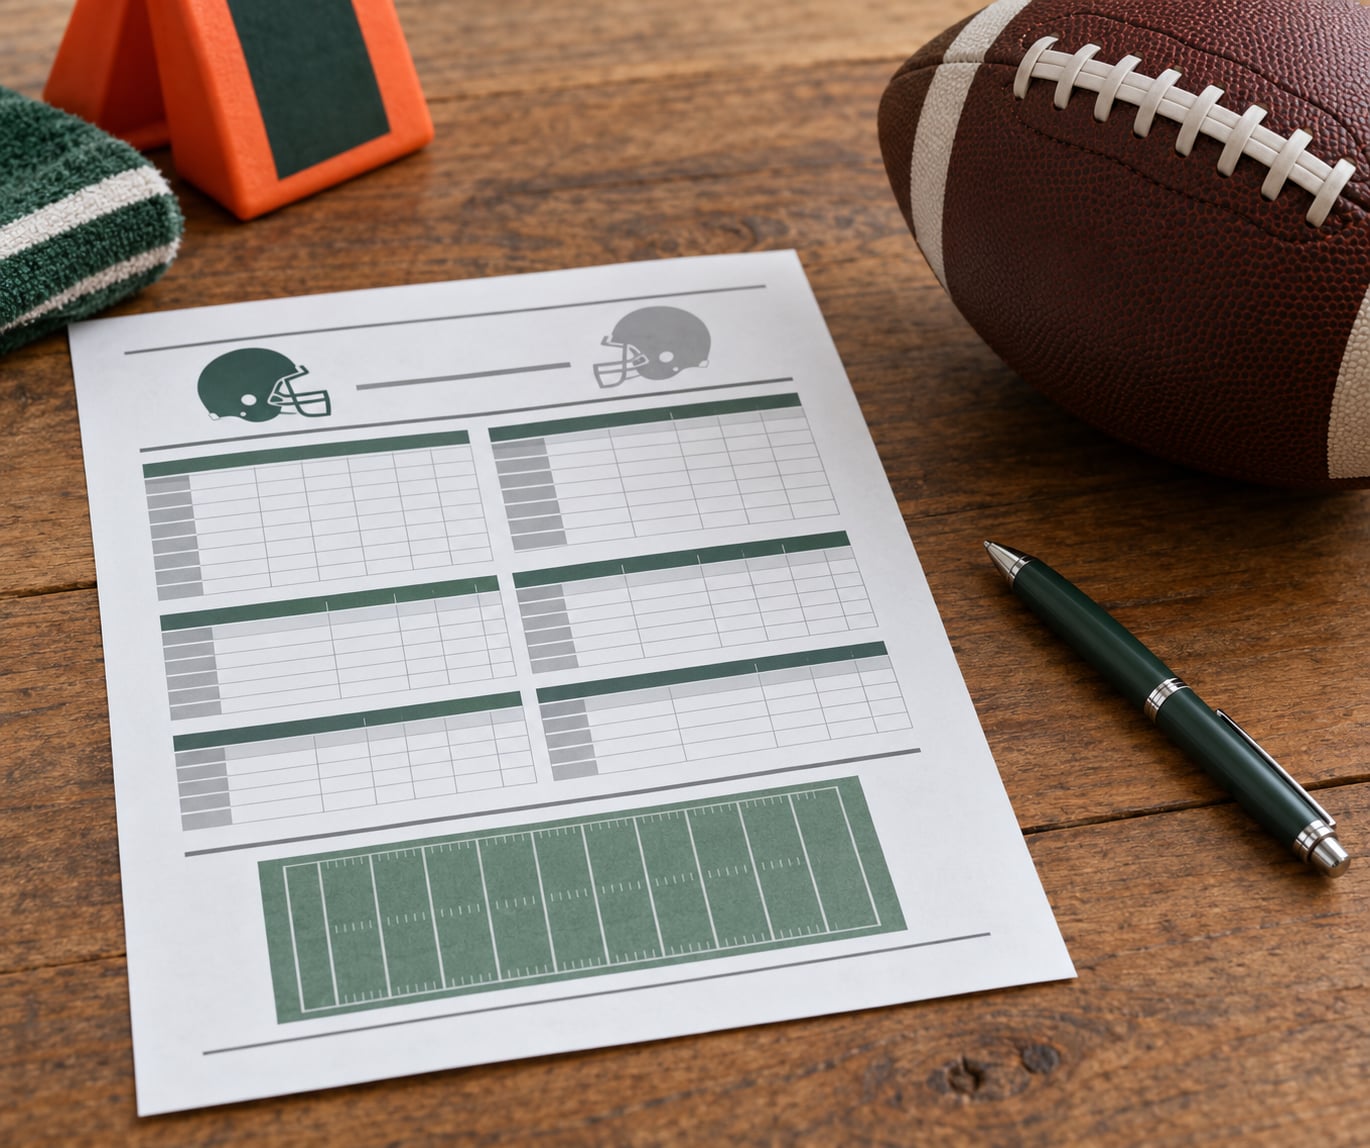
Before you start reading, know that the document has a fixed order. A typical college box score runs: game header, score by quarters, scoring summary, team statistics, individual statistics, drive chart, defensive statistics, participation report, then a condensed summary and play-by-play.
One more thing worth knowing before you dive in. NFL and college box scores are not formatted identically, and that is why the same question gets two different answers online. NFL versions lean on a completions-attempts-interceptions triplet and sack totals; college versions give you a fuller team table with drive charts and a defensive section that credits individual defenders. The labels below cover both.
Step-by-Step: How to Read a Football Box Score
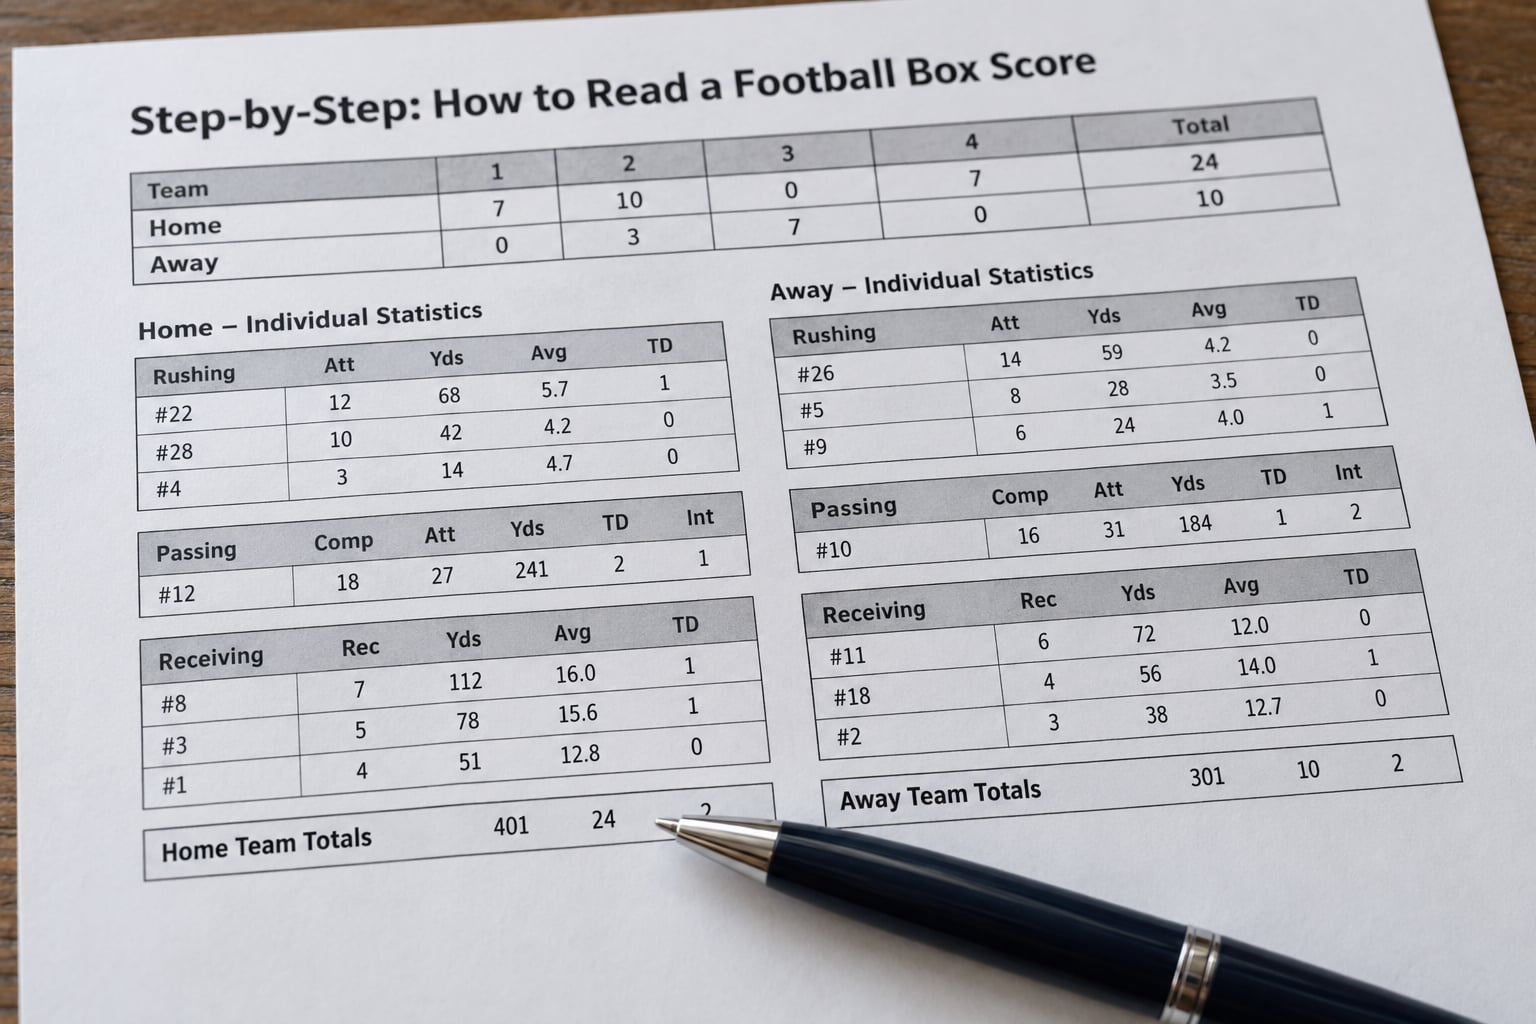
Read it in one direction, top to bottom, every time. The sections are ordered so each one answers a bigger question than the last, and skipping around is how people end up staring at a receiving line without knowing who won.
Step 1: Start With the Final Score and Quarter-by-Quarter Results
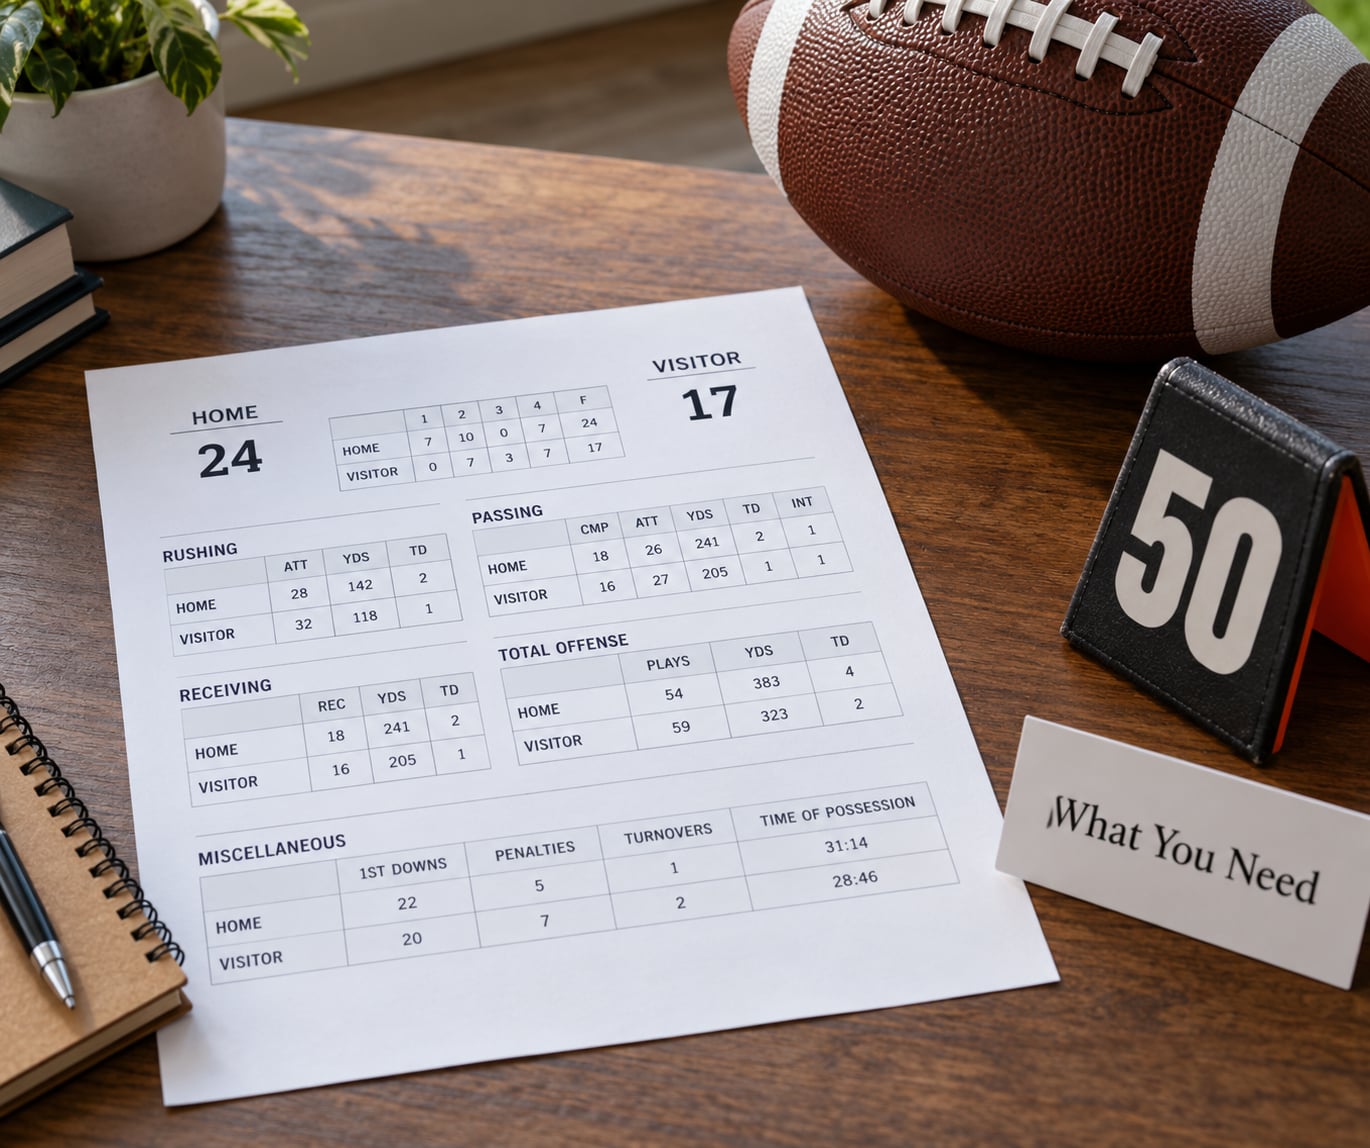
The very first table gives you one row per team and one column per quarter. Those four columns, plus a final column, tell you how the game actually unfolded, which the final number alone does not.
Look for the shape of it. A team that trailed 21-0 at halftime and outscored the opponent 28-7 in the second half played a different game than the one the final margin suggests. A team that led 24-7 in every quarter was in control the whole way and simply did not score more.
The header line above that table usually carries the date, the site, the stadium, attendance, and each team’s record going in. In the college game that record is often written as an overall record and a conference record side by side, which is a handy reminder that not every opponent on a schedule counts the same.
Step 2: Read the Team Totals
This is the section that answers who controlled the game. It is a two-column table, one column per team, and every row is a line you will see in almost any box score.
- First downs is the count of times a team earned a new set of downs. It is split three ways: rushing, passing, and penalty. A first down given by penalty is worth noticing because it costs the defense nothing.
- Net yards rushing is yards gained minus yards lost. You will usually also see attempts and average per rush, so a 40-yard line off 12 carries reads differently than 40 yards off 25.
- Net yards passing subtracts sacks and other losses from gross passing yardage. That is why a quarterback can show 260 passing yards and 230 net.
- Cmp-Att-Int is completions, attempts, interceptions, printed as one triplet like 24-38-1.
- Total offense is net rushing plus net passing. It is the single best volume number in the table, and average gain per play, total offense plays, tells you how much the offense got per snap.
- Third-down conversions and fourth-down conversions appear as made-of-attempted, like 4 of 12. These two lines describe far more about a game than total yardage does.
- Red-zone scores-chances shows how many times a team got inside the opponent 20 and how many times it scored there.
- Possession time is listed for both teams, sometimes with a quarter-by-quarter split underneath.
- Punts show number and yards, plus average net yards per punt and how many landed inside the opponent 20.
- Penalties are given as number and yards, and sacks as number and yards.
- Points off turnovers is tucked in near the bottom and is often the line that explains a lopsided score.
Step 3: Find the Major Individual Statistics
Below team totals come the individual lines, grouped by position. The rushing table repeats the team column labels, so learn them once and you can read every group after it.
Rushing columns read No., Yds, Avg, TD, Lg. No. is carries, Lg is the longest run. The passing table adds a Cmp-Att-Int triplet and often a percentage, then Yds, TD, Lg. Receiving uses Rec, Yds, Avg, TD, Lg, where Rec is receptions. Punting shows No., Yds, Avg, Lg, In 20 and TB for touchbacks. Returns are split into kickoff and punt.
Do not stop at the leader in each group. Scroll to see how many players contributed, because a quarterback with 24 completions spread across nine receivers is telling you something different than one who threw 24 passes to the same three guys.
Step 4: Compare the Numbers in Context
Knowing how to read a football box score means accepting that a raw total on its own is not a performance grade. Thirty carries for 140 yards is a great day against a bad front and an ordinary day against the best defense on the schedule, and the box score does not tell you which one you were watching.
So check three things before you react. Compare the number to that player’s own season average, not to their career. Notice the game script, because a quarterback sitting at 300 yards while trailing by twenty in the fourth quarter was passing to stay in it. And remember pace, since a team running 85 plays a game is generating more volume than one running 60.
Fans in r/nfl have made this point for years in threads about grading individual games: the box-score line for a quarterback can look excellent while the underlying film says something less flattering. The numbers are a starting point for the argument, not the end of it.
Step 5: Check the Scoring and Turnover Details
The scoring summary sits near the top of the document and lists every scoring play in order. Each row carries the quarter, the clock, the team, the play description, the kicker, how long the drive was in plays and yards, the time of possession, and the running score at that moment.
The running score column is the underrated one. Because it shows the score after every scoring play, you can see at a glance when a game turned, without reading a single play description.
Now hunt for how possessions ended. Look in the drive chart for turnovers on downs, interceptions, fumbles lost, and punts, and check the points off turnovers line in team totals. Turnovers are the most compressed explanation of a final score there is, and the fastest way to understand why the team you backed lost.
Then check the drive chart itself. Each row is one possession, showing plays and yards, the clock, the result, and the score after it. A # in the result column means the drive ended inside the red zone, which tells you immediately whether a team was moving the ball or not.
What the participation codes mean
The participation report lists every player who was in the game, sorted by position group. Most readers skip it, but it answers a question people ask constantly: a single letter O printed right after a player’s jersey number means that player was on the roster but did not play.
Search that one letter and you will find the same question asked over and over. A thread on r/NFLNoobs from a few years back is a single poster explaining they had stared at the notation for a full season without knowing what it meant, and every reply was the same answer.
Older NFL box scores spell it out instead as DNP for did not play. You will also see a small underline under a figure in statistical archives, which marks an incomplete or partial total, and team letter codes after defensive numbers that group players by position group, things like 1, 2, 3 followed by a letter. None of it needs memorizing, but all of it looks alarming until someone explains it.
Common Mistakes When Reading a Football Box Score
- Reading the individual leader and calling it the game. The top rushing line rarely decides anything. Fix: read team totals first, then look for the player who moved the team total.
- Confusing net yards with gross yards. Sacks and losses are already subtracted in net passing. Fix: compare net yards to first downs instead of to a raw yardage number.
- Assuming a conversion rate line means something it does not. Third-down conversions are printed as made of attempted, not as a percentage. Fix: divide the first number by the second before you compare teams.
- Ignoring field position. A defense that only gave up yards but kept the offense deep in its own territory was fine. Fix: check average starting field position if the box score provides it, and read punts and Inside 20 numbers.
- Comparing a team to itself across different opponents. Yardage against a ranked defense is a different achievement than yardage against a bad one. Fix: check the schedule and the opponent before you celebrate.
- Reading the scoreboard instead of the box score. The live graphic on TV shows down, distance, ball position and the play clock. The box score is the postgame document. Fix: know which one you are looking at before you start reading.
- Thinking the highest number is the most important. A receiver with 140 yards is less meaningful than a quarterback who threw no interceptions and kept the offense out of turnover range.
- Panicking at notation you do not recognise. O, DNP, TFL, BrUp, QBH, Sol, Ast, RZ, TOP. Fix: use the glossary table below instead of guessing.
A short glossary of the abbreviations you will hit first
| Abbreviation | Stands for | What it tells you |
|---|---|---|
| Cmp / Att / Int | Completions, attempts, interceptions | Accuracy, volume and how often the pass was picked off |
| Yds / Avg / Lg | Yards, average, longest | Volume, efficiency and the best single play |
| No. | Number of carries, receptions, punts or attempts | How many times it happened |
| NET | Net yards after losses and sacks | What the offense actually gained |
| TD / Lg | Touchdowns, longest | Scoring and the biggest single gain |
| TOP | Time of possession | How long the offense held the ball |
| RZ | Red zone | Drives that reached the opponent 20 |
| Sol / Ast | Solo and assisted tackles | Full credit and shared credit on a tackle |
| TFL | Tackles for loss | Defensive plays that lost the offense yards |
| FF / FR | Forced fumble, fumble recovered | Who created and who claimed the turnover |
| BrUp | Pass breakup | A defended throw the quarterback did not complete |
| QBH | Quarterback hurry | Pressure that forced a throw or a scramble |
| PD | Passes defended | Coverage attempts, broken up or completed |
| O / DNP | Did not play | Rostered for the game but never entered |
| Pl-Yds | Plays and yards on a drive | How long a possession lasted and how far it moved |
Add a few more and you can read any line on the page. REC means receptions, TOTAL is rushing plus passing yards, Y/A is yards per attempt, Y/G is yards per game, TO is timeouts, In 20 is punts landed inside the 20, and pct is simply a percentage.
Frequently Asked Questions
What does a football box score tell you?
A football box score is the official postgame record of a game. It gives you the score by quarter, how every score happened, total yardage and first downs for both teams, individual stat lines for every player, defensive statistics, a drive chart showing how each possession ended, and a participation report listing who played. Read in that order, it explains not just who won but how.
Which team’s score is listed first in a box score?
The home team is listed first on most scoreboards and broadcast graphics. In a written box score the order can vary by site, so the safest habit is to find each team’s row and read the number directly across from its name rather than assuming a position. Some pages label the rows with the full team name, which removes the guessing.
What does the O next to a player’s number mean?
The O means the player did not play. It appears right after the jersey number in the participation report, marking someone who was on the roster and in uniform but never entered the game. Older NFL box scores write it as DNP instead. Some sites also use a small underline beneath a figure to show that a total is incomplete or partial.
Is every 10 yards a first down?
No. A team must gain whatever distance is needed to reach the next first-down marker, and the marker chains along the field as the team advances. From the 20, the first marker is at the 30, then the 40. That is why you see stops of eight or nine yards end a drive as well as longer ones, and it is why net yards matter more than gross yardage.
What does net yards mean in football stats?
Net yards are the yards an offense or defense actually kept after losses are subtracted. For passing, sacks and hits in the backfield come out of the total, so a quarterback with 260 passing yards and six sacks thrown for 230 shows up as 230 net. Comparing net yards to first downs gives a much truer picture of efficiency than raw yardage does.
How do I tell which team played better when one of them lost?
Look past the score and read four lines: third-down conversions, red-zone scores compared to chances, turnover margin, and net yards per play. A team that won the turnover battle and held the ball for 38 minutes often played far better than the winner. Points off turnovers usually explains the gap in about three seconds of reading.
Conclusion
Work top to bottom in the same order every time: score by quarters, scoring summary, team totals, individual stats, drive chart, participation report. Once you get that habit, the box score stops being intimidating and becomes the fastest way to understand any game you watched.
If you only check two lines on the next one you read, make them third-down conversions and points off turnovers. Those two explain more final scores than all the yardage in the document combined.