College football advanced stats grade a play by how difficult it was, not just what happened. A five-yard run on fourth down at midfield counts for more than a 30-yard run at the goal line, so two teams with identical box scores can have completely different efficiency profiles underneath.
If you have ever nodded along when a postgame show said “that was a negative-EPA play” without knowing what that meant, you are in the right place. Getting how college football advanced stats work for casual fans down to one idea is not hard: context. Every number you hear on television traces back to it.
One note up front. The math here is not the hard part. Broadcast graphics dump a dozen numbers on screen at once, which is the actual barrier. Take them one at a time and most of them are obvious.
Table of Contents
- What Are College Football Advanced Stats?
- Which Metrics Matter Most for Casual Fans?
- How Do Efficiency and Success Rate Metrics Work?
- How Do Explosive Plays and Finishing Drive the Story?
- How Can Field Position and Turnover Metrics Change the Game?
- What Do Defensive Metrics Reveal?
- How Do You Read Advanced Stats During a Game?
- Advanced Stats vs. the Box Score: What Should Fans Watch?
- Frequently Asked Questions
What Are College Football Advanced Stats?
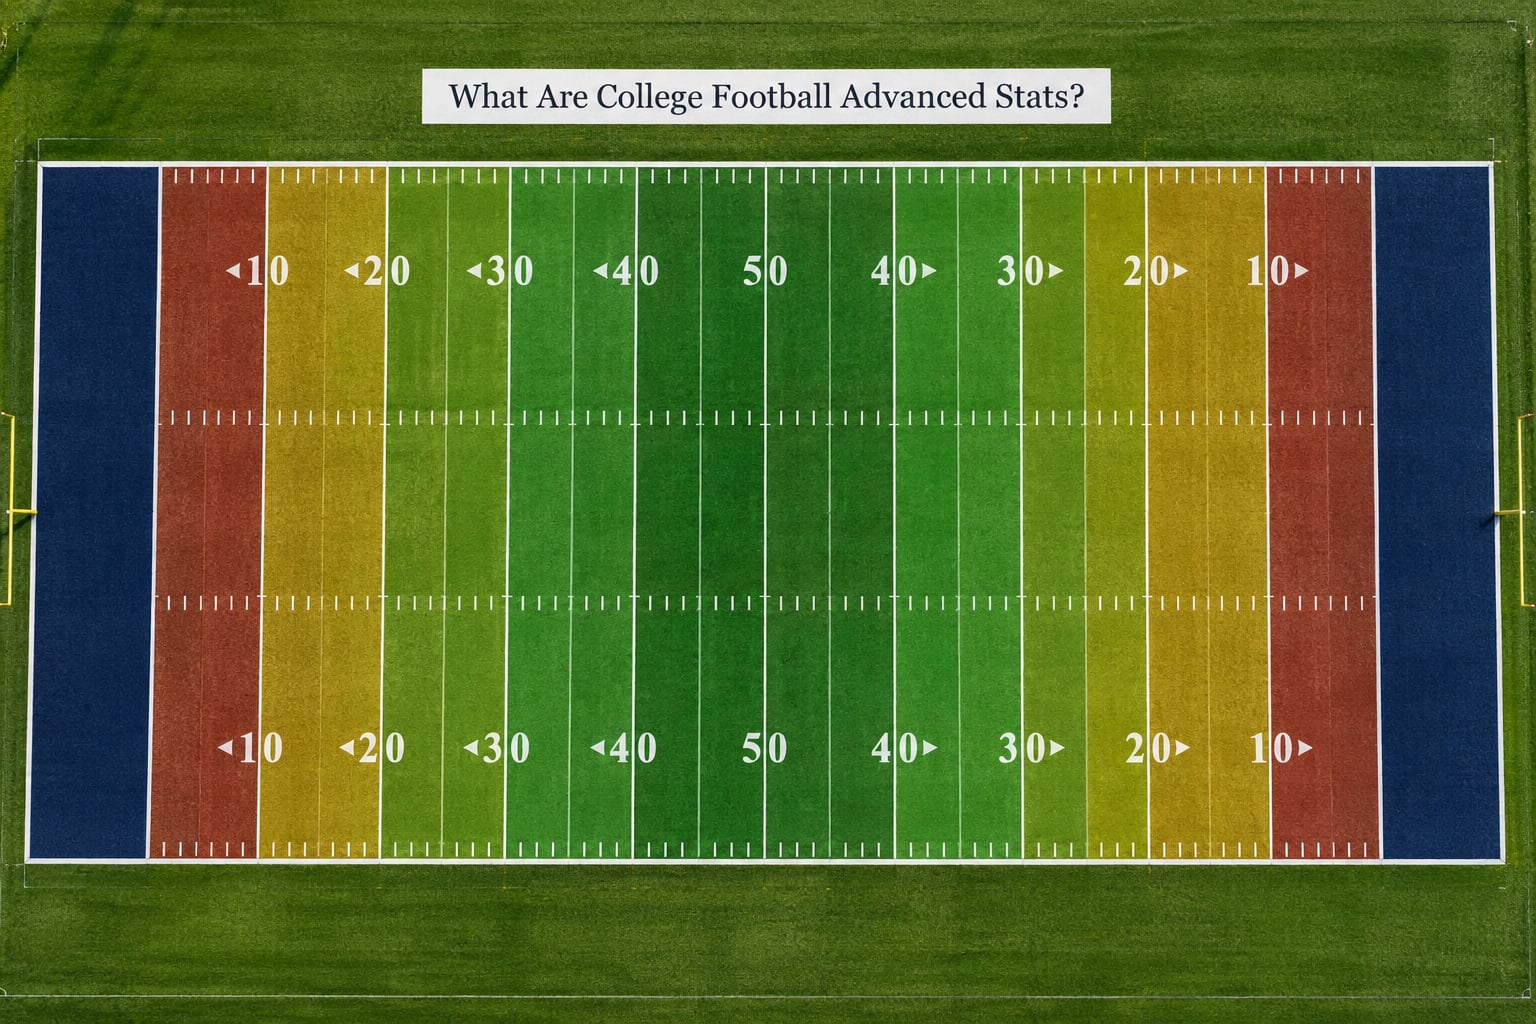
Advanced stats are numbers that rate a play, drive or team based on the difficulty of the situation it happened in. Traditional box-score numbers record what happened. Advanced stats weigh how hard it was to get there.
Think about 450 rushing yards. Against a defense that was missing its best player and blitzing on every down, that number means something very different than 450 against a healthy front that loaded the box eight times a game. The yardage is identical. The context is not.
Coaches have used adjusted numbers for decades. Bill Connelly at ESPN built SP+ and Brian Fremeau at Football Outsiders built the Fremeau Efficiency Index and F/+, and those two names show up in every argument about who is better this week. Naming the creators matters, because it is the fastest way to know what a model is built on.
Which Metrics Matter Most for Casual Fans?
Five metric families cover most of what you will ever hear. You do not need all of them, but knowing which family a number belongs to tells you what question it is trying to answer.
| Metric family | What it measures | What a good number looks like | Why a fan should care |
|---|---|---|---|
| Efficiency (EPA) | Expected points a play added relative to where it started | Positive on most plays, strongly positive when scoring | Separates a real drive from a lucky one |
| Consistency (success rate) | Share of plays that keep the drive alive | Around 45 percent or higher | Shows whether an offense is reliable or lucky |
| Explosiveness | Value generated specifically on successful plays | Half of a team’s EPA or more | Explains how a slow offense still scores |
| Field position | Where drives start | Own 30 to 40 as a baseline | Fewer possessions needed to score |
| Defensive impact | Value a unit takes away or concedes | Negative EPA allowed for defenses | Shows which side of the ball is winning |
If you only learn one, make it efficiency. The rest are supporting arguments.
How Do Efficiency and Success Rate Metrics Work?
Both rest on the expected points model, which assigns every situation on the field a probability of eventually scoring. That situation is the down, the distance, the field position and usually the score and clock. A first-and-10 at your own 25 is worth very little. First-and-goal from the nine is worth a lot.
| Situation | Approximate expected points | What it means for the next play |
|---|---|---|
| 1st and 10, own 25 | Roughly 1.5 to 2 | Almost any gain is a good play |
| 2nd and 7, opponent 40 | Roughly 3 to 3.5 | A conversion of 7 or more keeps the drive alive |
| 3rd and 3, own 20 | Roughly 2.5 | Getting the first down is a clear win on the drive |
| 1st and goal at the 9 | Roughly 6.5 | Touchdown expected, so a big loss is costly |
Those are approximate averages, not a team’s personal table. The point is the shape: value climbs as you get closer, and value jumps when you earn a new first down.
What EPA actually measures
Expected points added is the difference between the expected points before a play and the expected points after it. Take a second-and-7 at the opponent 40, where the situation is worth about 3.2 expected points. A five-yard gain to set up third-and-2 pushes the expected value to roughly 3.5. The play was worth about +0.3 EPA.
Now the same five-yard gain on third-and-10 at your own 20. The situation was worth about 2.0. The catch short of the marker leaves you at fourth-and-5, worth maybe 1.2. That play was about -0.8 EPA. Same yardage, opposite sign, because the situations are reversed.
Aggregate that per play across a season and you get EPA per play, the cleanest single number for comparing two teams. Raw EPA totals mostly measure how many snaps a team had, so per play is the version worth memorizing.
How success rate is scored
Success rate is simpler. A play counts as a success if it gains enough yardage on the down to set up a new first down. The thresholds run 40 percent of the distance to go on first down, 70 percent on second down, and 100 percent on third or fourth down. Five yards on first-and-10 fails. Three yards on second-and-3 succeeds.
Net success rate weights that binary result by the EPA the play produced, so a ten-yard gain on third-and-20 counts for more than a barely-converting first down. A strong raw success rate can still earn you nothing on a drive chart, because a game is decided by a handful of possessions and only the opponent’s best ones really matter.
How college football advanced stats work across a whole drive
Track a single possession and the logic is obvious. Start at your own 20, grind out a long drive, and score a touchdown. Every play is small, most are successful, and the drive produces roughly six expected points against a 1.7-point starting expectation. The box score shows “13 plays, 75 yards.” EPA shows a genuinely good possession.
Compare that to three plays for 8 yards, a fumble, and a punt. The yardage barely registers in either system. The efficiency difference is enormous, which is why a turnover on downs scores a deeply negative EPA number.
How Do Explosive Plays and Finishing Drive the Story?
Explosiveness measures value generated on successful plays only. An offense can be efficient and boring, explosive and reckless, or, most commonly, one of each. Teams that only grind out a high success rate tend to stall against good defenses, because nobody is threatening the deep coverage.
An explosive play rate counts gains of at least 15 yards, and 20-plus more commonly in modern usage. Half a team’s EPA coming on explosive plays is a rough marker of a real vertical threat. Much less than that and the offense is likely leaning entirely on consistent short gains.
Points per opportunity looks at the other end. Count every drive that crosses midfield, then ask how many points the offense scored on them. A team going 0 for 8 there is not scoring efficiently, whatever the yards-per-play number says.
This is how one long touchdown changes a game without every yard counting equally. A 60-yard pass might be worth more EPA than four first downs combined, because it crosses the scoring threshold in a single snap. Momentum from a big play is not a myth analysts invented, but it is also not a stat. What the numbers measure is the value, not the feeling.
How Can Field Position and Turnover Metrics Change the Game?
Average starting field position is the quietest advantage in football. Teams that consistently receive the ball near their own 40 need fewer possessions to reach the end zone, which effectively manufactures extra drives. Two teams can run identical offenses and score very different totals purely on where the ball started.
Turnovers get scored the same way. A fumble deep in opponent territory destroys roughly the expected value of the possession that built it. That is why turnover margin shows up on so many postgame stat lines, and why a team can win on turnover margin alone while losing comfortably on efficiency.
Third-down conversion rate and yards per play differential sit in between the box score and the analytics. They are easy to read, they require no model to interpret, and they still carry the situational weighting fans care about.
Why a team can win while posting worse efficiency numbers
Four mechanisms do most of the work here, and every upset runs on some combination of them.
First, garbage time. A team leading by 20 in the fourth quarter will run the ball for three and clock it. That padding drive scores negative EPA, and it drags a season number down for no meaningful reason. A team that trailed all game and kept passing had to play real football, which flatters its efficiency.
Second, opponent adjustment. Beating a team rated far below yours and losing to a team rated far above are not equally informative. Unadjusted numbers treat them as identical wins.
Third, explosive plays. Ten explosive gains in a game can offset a large number of stalled drives, and explosiveness is volatile in a way that consistent efficiency is not.
Fourth, variance. Turnovers, blocked kicks and deflections are close to coin flips, and a single one can account for a double-digit margin. That is noise, not performance, and it is the main reason a season-long rating is a more honest read than a single game.
What Do Defensive Metrics Reveal?
Defensive EPA is the mirror image. A good defense posts a negative number, meaning it took expected value away from the offense. Read it with the offensive number facing it: two efficient offenses and two negative-EPA defenses should produce a low-scoring game, and that is a real forecasting tool, not a vibe.
Pressures and sacks get counted separately because pressure can arrive without a sack. Havoc rate combines pressures, tackles for loss, and deflections forced as a share of plays, which is a decent stand-in for disruption without needing a full charting crew.
On the back end, coverage success rate and explosive plays allowed describe the same trade from the other direction. A defense that gives up completions but never a big one is surviving; one that allows few completions but gets torched twice is probably going to give the game away.
Do not read any single one as a player grade. Per-play EPA in particular is an inexact science: an interception graded at minus five EPA is a genuinely terrible moment, and it still says nothing about the other forty snaps that drive. Both things are true.
Where team ratings like SP+ and F/+ fit
These roll everything above into one team number.
| System | Creator | What it weighs most | How to read the number |
|---|---|---|---|
| AP Poll | Votes from AP sportswriters | Head coaches’ impressions, team results, preseason expectation | Rank 1 to 25, higher is claimed, not measured |
| Coaches Poll | Head coaches | Mostly recent results and conference reputation | Rank 1 to 25, tends to lag late in the season |
| SP+ | Bill Connelly, ESPN | Per-play efficiency, opponent and tempo adjusted | Zero is average, positive is above average |
| F/+ | Brian Fremeau, Football Outsiders | Drive-level possessions split into offensive and defensive components | Zero percent is perfectly average |
That zero anchor is the most useful calibration fact in this whole article. A team at plus 8 SP+ is meaningfully above average. A team at minus 4 is meaningfully below it. None of it tells you the team will win, because ratings describe how a team has played, not what a coin flip does next.
The polls disagree with the ratings constantly, and that disagreement is expected rather than a bug. The polls react to wins. The ratings react to how the wins were assembled.
How Do You Read Advanced Stats During a Game?
Four steps, in order. Most people skip to the third one and end up arguing about a number that does not fit the situation.
Start with the situation, before the number
Down, distance, field position, score margin, time remaining. That takes about five seconds and it determines which metric is even relevant. A run success rate on a 4th and 4 in a blowout is a rounding error, whatever the aggregate says.
Match the metric to the situation
Short yardage and drive survival: success rate. Progress over a long stretch of field: EPA per play. Deep threat: explosive play rate. Clock management: field position. There is no single number that answers everything, and commentators switching mid-sentence is not confusion on your part.
Add the game context
Trailing by 21 in the fourth quarter changes what a play is worth to the coach and what it was worth to the model. The model rates the play, not the decision. A pass on third-and-4 while down 28 is a defensible coach call that will look terrible in the EPA column.
Watch the pattern, not the play
Individual plays are noisy. One play is a coin flip; a drive is a sample; a quarter is a trend. Look at what a unit does repeatedly. A defense that gives up explosive plays on five straight third-and-longs is telling you something a single sack never could.
Advanced Stats vs. the Box Score: What Should Fans Watch?
Both formats are useful precisely because they fail in opposite directions.
| Format | Reveals best | Falls short on | Watch it for |
|---|---|---|---|
| Box score | Totals, volume, who touched the ball | Situation and difficulty | Volume trends across a season |
| Advanced stats | Per-play value, efficiency, context weighting | Small samples, garbage time, model disagreement | Whether a trend is real |
| Both together | What happened and how hard it was | Nothing much | Your default read |
A concrete case: a quarterback finishes with 310 passing yards and a 75 percent completion rate. On the box score that reads excellent. If it came on eight attempts against a prevent defense after the team was up 24, the advanced numbers will show you why it should not carry over. Neither number is lying. They are answering different questions.
The failure mode of advanced stats is treating a model output as a fact. “SP+ has Texas ranked fourth” is a description of how efficient Texas has been against the teams it has played, adjusted for difficulty. It is not a prediction, and a model that never disagrees with your preseason opinion is not a model.
Frequently Asked Questions
What are the main advanced stats in college football?
The core group is expected points added (EPA) per play, success rate, explosiveness, average starting field position, points per opportunity, and defensive EPA. Together they cover per-play value, consistency, big-play threat, field position, drive finishing and defensive impact. Ratings like SP+ and F/+ roll those inputs into a single opponent-adjusted team number.
What does success rate mean in football?
Success rate is the share of plays that gain enough yardage on the down to set up a new first down. The thresholds are 40 percent of the distance to go on first down, 70 percent on second down, and 100 percent on third or fourth down. A successful play is not always a good play, which is why net success rate also weights each result by the EPA it produced.
What does expected points added (EPA) mean?
EPA is the change in expected points from one play to the next. A model first assigns a scoring probability to every down, distance and field position combination. The play’s EPA is the difference between the expected points before and after it. A five-yard gain can be positive on third-and-3 and negative on third-and-12, because the situations are worth very different amounts.
What is the difference between success rate and net success rate?
Plain success rate treats every successful play as equal. Net success rate multiplies that binary result by the EPA the play generated, so a big conversion counts for more than a barely legal one to gain a new first down. On a team that piles up huge gains, net success rate is noticeably higher than the raw number.
How are college football power rankings determined?
The AP Poll and Coaches Poll are votes, weighted mostly by recent results and preseason reputation. SP+, created by Bill Connelly at ESPN, and F/+, created by Brian Fremeau at Football Outsiders, are opponent-adjusted efficiency ratings where zero means average. Because the polls chase wins and the ratings weigh how the wins happened, they disagree often, and that is by design.
Start with EPA per play and success rate, then add field position once those make sense on their own. Read the box score for what happened and the adjusted numbers for how hard it was, and treat every rating as a description of the past rather than a forecast of the weekend. CollegeFootballData.com team pages and ESPN matchup pages both show most of this free, so nothing here needs a subscription to check any of it.