If you search for college football power rankings you will get three very different things mixed together: human opinion lists, the two major polls, and computer models that rate every team on a single number. This guide explains how college football power rankings are built, why the systems disagree, and how to read any one of them without getting fooled. It is about methodology, not this week’s top 25.
One thing worth saying up front: the weekly “power rankings” most sites publish are opinion products. They use a formula the writer will describe in a sentence, then apply judgment to the rest. The AP Poll, the Coaches Poll and the College Football Playoff committee operate on different rules entirely, and computer models like ESPN’s Football Power Index run on play-by-play data. Treating them as interchangeable is the single biggest source of confusion in this topic.
Updated for 2026 to reflect the 12-team playoff era. Below, the rankings are compared side by side first, then broken apart input by input.
Table of Contents
- What Are College Football Power Rankings?
- How Are the Basic Team Ratings Calculated?
- Which Statistics Matter Most?
- How Do Polls and Computer Models Differ?
- How Much Does Subjective Opinion Matter?
- How Are New Teams and Early-Season Rankings Handled?
- How Often Do Power Rankings Change?
- How Can You Evaluate a Power Ranking for Yourself?
- Why Do Rankings Sometimes Disagree?
- Frequently Asked Questions
- Are college football power rankings meant to predict the national championship?
- What is the difference between a power ranking and the AP Poll?
- Why does one computer model rank teams differently from another?
- Are winning percentage and strength of schedule enough to build a ranking?
- When are college football power rankings most accurate?
- Should fans follow a human poll, a computer model, or a consensus ranking?
- Conclusion
What Are College Football Power Rankings?
A college football power ranking is an ordered list of teams built from one of three engines: human ballots, a selection committee’s judgment, or a computer model that estimates team strength from adjusted efficiency. It is not the same thing as win-loss record, and it is not the same thing as the AP Poll.
Record alone is a weak ranking tool. A team that goes 5-0 in a weak conference and a team that goes 5-0 against a brutal slate are treated identically by a bare win percentage, which is why nearly every serious ranking adjusts for opponent strength in some form.
| System | Who or what builds it | Core inputs | Update cadence | Best used for |
|---|---|---|---|---|
| AP Poll | National sportswriters | Confidential ballots, team results, voter judgment | Weekly, Sundays | Tracking consensus perception of who is best |
| Coaches Poll | Division I FBS head coaches | Coaches’ ballots plus the AP vote | Weekly, Sundays | Coaches’ view, used as a playoff seeding input |
| Playoff committee | 13 appointed committee members | Same performance data, plus committee discretion | Weekly in-season, then after season and conference championships | Selecting and seeding the playoff field |
| ESPN Football Power Index | Computer model | Adjusted expected points added per play, opponent adjustment, priors, simulation | Continuously during and between games | Projecting a game before it is played |
| S&P+ | Computer model | Equivalent points per play efficiency, opponent-adjusted | Weekly | Evaluating true team quality independent of record |
| Sagarin, Fremeau, Massey-Peabody | Academic computer models | Win percentage, margin of victory, opponent-adjusted scoring | Weekly, some run historical backtests | Long-run predictive testing and simplicity |
| Media power rankings | A writer or outlet | Anything the writer decides, often with a stated formula | Weekly or more often | Argument and engagement, not forecasting |
If you take one thing from that table: only the last row is unrepeatable. The rows above it can, in principle, be reconstructed by anyone willing to do the work.
How Are the Basic Team Ratings Calculated?
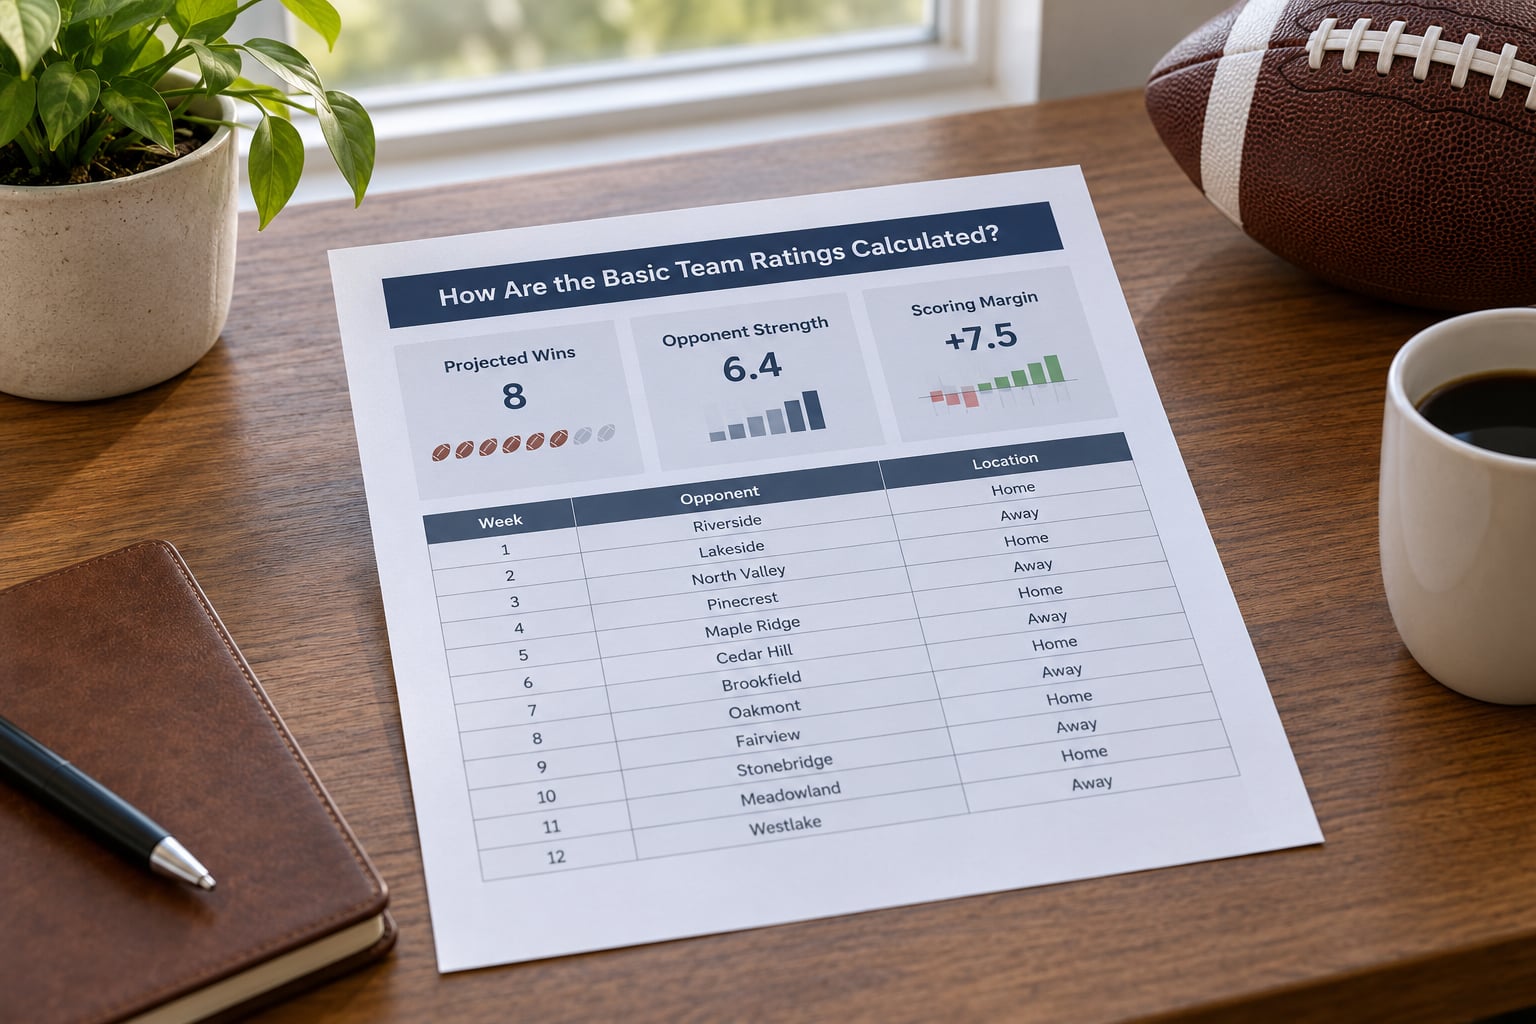
Every computer rating, from the simplest spreadsheet model to the Football Power Index, reduces the season to one estimated number and then spreads teams out around it. The most common version of that number is projected wins, or the equivalent, and the inputs below are how it gets there.
Projected wins is the output most fans see because it is the easiest to understand: how many games this team would win if it played its schedule again as its true talent. A team that finishes 10-2 in a soft conference can carry a projected-win value well above ten, because the model believes it beat teams it was projected to lose to.
Opponent adjustment is the correction that matters most. It compares what a team did against what its opponents were expected to do, and it recursively pushes credit toward teams that beat other strong teams. Without this step, a ranking is just a scoring list.
| Input | What it measures | Effect on a sample team rated mid-tier |
|---|---|---|
| Projected wins | Output total derived from all other inputs | Anchors the whole list; the highest projected-win team usually sits at the top |
| Opponent strength | Quality of the schedule already played | Beating two ranked teams pushes the team up several spots; beating two weak ones barely moves it |
| Margin of victory | How decisively games were won | A 38-7 win over a good opponent carries more weight than a 24-21 win, because dominance is less likely to be luck |
| Efficiency per play | Points or value added per snap, not per drive | Removes the effect of field position and short fields, so garbage-time scores stop inflating a team |
| Returning production | Share of snaps and production coming back | Feeds the preseason starting point; a rebuilt offense drags a team’s prior down before a snap is taken |
| Schedule adjustment | Unplayed games and non-conference slates | Early-season ratings fill in future games with placeholders, which is why week one rankings swing hard |
The Football Power Index adds a step most rankings skip. It estimates how good a team is on a play-by-play basis, adjusts for opponent, adds a prior built from returning players and recruiting, then runs the season tens of thousands of times to output win probabilities and postseason odds. It also makes small adjustments for home field, rest, travel distance and altitude, so a long trip across the country costs a team a fraction of a point rather than nothing.
S&P+ takes a different route to the same idea. It puts offense and defense on one scale using equivalent points per play, so a good rushing offense that keeps giving up short fields is credited less than its yardage totals suggest.
Which Statistics Matter Most?
Rank the inputs like this and the order rarely changes: efficiency per play adjusted for opponent, then strength of schedule, then margin of victory within a normal range, then raw scoring, with win percentage used mostly as a sanity check. Raw offense and defense totals rank near the bottom because they reward teams that accumulate yardage against soft teams in garbage time.
Efficiency metrics outrank totals because a drive that starts at the 40-yard line and ends in a punt is not the same accomplishment as a drive that starts on its own 20 and produces points. Expected points added, usually written EPA, is the change in a team’s expected scoring value across a single play. Win probability is the simplified version. Both are far more stable week to week than scoring margin.
Sample size is the quiet spoiler. Early in a season a team with two games played is mostly measuring its schedule, not itself. Rankings that look sharp in September are usually the ones applying the strongest prior, which just means they trust last season more heavily. By late November the same inputs produce genuinely informative numbers.
| Metric | What it tells you | Used by |
|---|---|---|
| Expected points added (EPA) | Value a team adds or gives up per play | FPI, play-by-play models |
| Success rate | Share of plays that gain positive expected value, split by down | Situational models, often alongside EPA |
| Points per possession | Scoring without field position noise | Sagarin and other public models |
| Margin of victory | Dominance, capped to avoid rewarding runaways | Simple public models |
| Strength of schedule | Who you played, weighted recursively | Nearly every system |
| Explosive plays, finishing drives, field position | The situations efficiency metrics reward | S&P+ and companion ratings |
How Do Polls and Computer Models Differ?
Human polls gather confidential ballots and add them up; computer models run the same math on every team whether or not anyone has an opinion about them. The two answer slightly different questions, which is why they drift apart in August and rarely finish the season in agreement.
The AP Poll comes from roughly 60 sportswriters. Each submits a ranked ballot confidentially, points are assigned by position, and totals are summed with ties broken by win percentage. No methodology is published beyond that, which is the honest answer to most arguments about it.
The Coaches Poll collects ballots from Division I FBS head coaches and folds in the AP vote as a component. It has a long institutional history as a playoff seeding input, and coaches tend to weight recent games and their own conference results differently than writers do.
| Dimension | AP Poll | Coaches Poll | Computer models | Playoff committee |
|---|---|---|---|---|
| Who decides | Writers | Coaches, partly blended with AP | A published formula | 13 members with discretion |
| Inputs | Results plus voter judgment | Results plus coach judgment | Play-by-play and scoring data | Same data, weighed by members |
| Main strength | Absorbs information no model captures, like locker-room context | Direct observation of the sport from coaches | Consistent, reproducible, no favoritism | Can weigh recent games and head-to-head results |
| Main weakness | Undisclosed weighting, groupthink, conference bias | Same, plus coaches voting for their own path | Small samples, early-season priors, model misspecification | Deliberate judgment, sometimes unexplained |
| Updates | Weekly after games | Weekly after games | After every game, plus preseason priors | Weekly, plus postseason and championship reveals |
| Publicly reproducible? | No | No | Usually, if the formula is published | No |
Being unreproducible is the honest weak spot of the polls. You cannot audit a secret ballot, and fans on r/CFB have long argued that conference clustering and recency bias show up in the totals year after year. Models have the mirror-image problem: they are perfectly consistent and occasionally wrong in a way no human would be.
Consensus rankings, which average the major polls and computer outputs into one number, try to split the difference. They reduce single-source quirks but they also launder away the information that disagreement itself carries.
How Much Does Subjective Opinion Matter?
Judgment enters every ranking somewhere, including the ones that claim to be pure math. The difference is whether the model states its adjustments or leaves them implicit.
Evidence-based adjustments are adjustments you can point at. A starting quarterback out changes a team’s expected points per play. A team returning 80 percent of its snaps starts the season near where it finished the last one. A conference championship win is real game data. Those belong in any honest rating.
Speculation is everything else: projecting a freshman to be an all-conference player, adjusting for a coaching hire based on the coach’s record elsewhere, penalizing a team for a narrow loss in ugly weather, rewarding a team for beating a rival it was already expected to beat. None of it is crazy. All of it is unfalsifiable, and it is where media power rankings live full time.
The playoff committee is deliberately built on the other end of that spectrum. Its job is to rank 130 teams where no formula is trustworthy enough, so members are expected to weigh recent games, conference championships, common opponents and head-to-head results in ways that would be indefensible in a spreadsheet. The committee publishes selection procedures each year, and those procedures explicitly allow for discretion. Discretion is the feature, not a leak in the system.
How Are New Teams and Early-Season Rankings Handled?
A model that started at zero would have no idea where an unplayed Georgia or a rebuilt Oregon belongs in September. So rankings open with a prior: a starting estimate built from what happened last year plus who comes back.
The Football Power Index documents its priors clearly, which is unusually helpful. It weights roughly four seasons of adjusted performance with the most recent counting most, then layers in returning starters with extra weight on the quarterback position, a binary indicator for whether the head coach returned, and recruiting class strength including the transfer portal.
That structure explains why a team with a new starting quarterback drops before it plays and why some programs move for reasons that have nothing to do with September results. Two preseason rankings built on different priors can disagree about teams that have never lined up against each other, and neither one is wrong.
Unplayed games get filled with placeholders pulled from the opponent’s prior and expected home field advantage. That is why week-one ratings lurch. A team whose only real result is an easy opener looks great until it faces anyone, and a team with one brutal non-conference date looks worse than it is. Treat any ranking before week three as a set of expectations rather than a measurement.
How Often Do Power Rankings Change?
Polls move once a week, after games resolve. Models move after every game, because each result is new input to a running estimate. Media power rankings move on whatever schedule the writer prefers, often within days.
When a model moves a team sharply, the cause is usually a statistical artifact rather than a change in talent. Blowout wins carry more weight than narrow ones. A team that beat a very good opponent by three points gains less than a team that beat a slightly worse opponent by thirty. Late-season garbage time gets discounted in some models and counted in others. These are all reasons a team can jump eight spots without anyone on the field changing.
Movement between two polls also says more about their methods than about football. If a model ranks a team highly and the AP does not, the informative question is why: different time horizon, different treatment of a close loss, different conference priors, or a specific game one system weighted and the other ignored. Ask that instead of asking which list is right.
How Can You Evaluate a Power Ranking for Yourself?
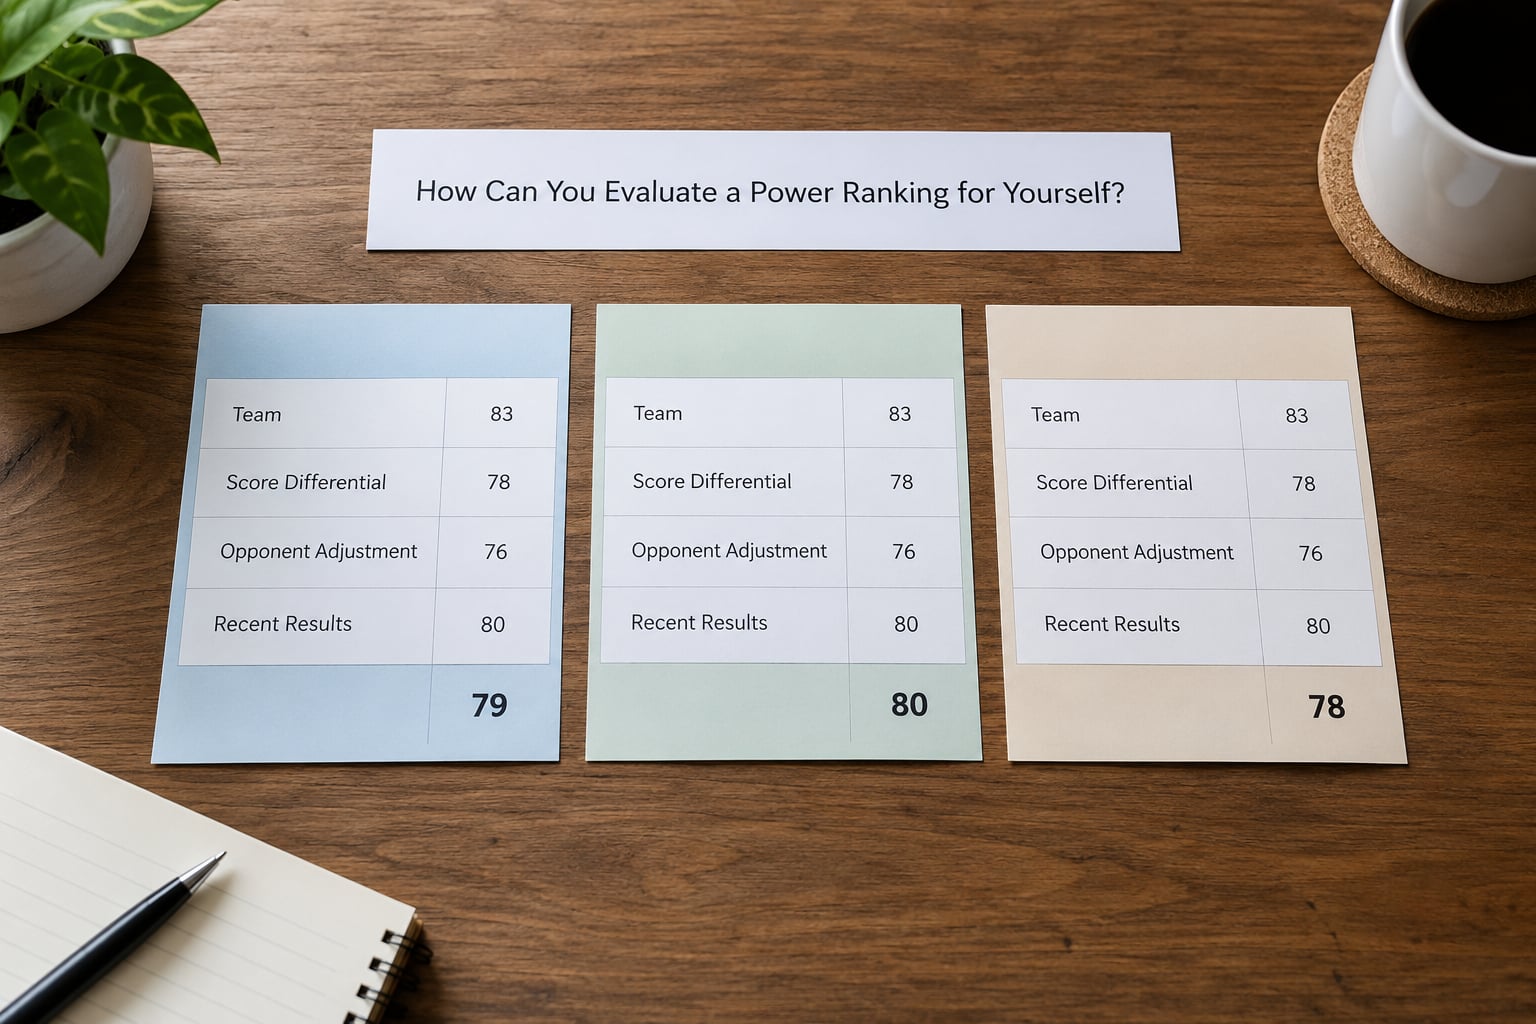
Seven checks, in order, tell you whether a ranking deserves your attention. Most take under a minute once you know where to look.
- Find the methodology. If the publisher will not state it, treat every number on the list as an opinion wearing a lab coat.
- Check that it adjusts for opponent. A ranking with no strength-of-schedule component cannot tell a good team from a lucky one.
- Look for efficiency inputs. Points per play or equivalent points per play beats yards per game every time.
- Weight recent games sensibly and check whether the system discounts or rewards blowouts. Both choices are legitimate, and big unearned jumps usually come from one of them.
- Look at availability. Check whether the ranking’s top teams lost a starting quarterback or two tackles before the number was published.
- Read the schedule context. Ask what the team has actually beaten. A high rank built on a soft non-conference slate means something different in November than in September.
- Compare across reputable sources. When the AP, the Coaches Poll and a published model all converge, the signal is stronger than any one list. When they split, the disagreement itself is the useful information.
One more habit pays off if you want to do this properly: build your own. Fans on r/excel and r/CFB do it constantly, and the exercise teaches more than any explainer. Start with three columns, win percentage, points differential, and an opponent strength value pulled from the same sheet, normalize them, weight them 40-30-30, and sort. It will be worse than a published model and you will understand exactly why.
Why Do Rankings Sometimes Disagree?
Time horizon is usually the first answer. Some systems lean on the whole season to date, others weight the last three games heavily. A team with a bad non-conference loss in September and a dominant October will sit in a different spot in each.
Stat choices come next, and they are bigger than most readers expect. Margin of victory and efficiency per play disagree all the time, because one measures the scoreboard and the other measures the process that produced it.
Human factors explain the rest. Voters have conference loyalties, regional blind spots and a tendency to overvalue dominant wins over the opponent they already expected to beat. Committees have the same instincts plus a job description that asks them to exercise judgment. Models have no instincts at all, which removes one error source and adds another: a formula built on last decade’s football will keep rating the league that no longer exists.
Finally, some disagreement is definitional. A resume ranking asks who has the most impressive body of work. A predictive ranking asks who would win a game played tomorrow. Those are different questions, and during a season where a team has beaten nobody good and lost to nobody bad, the answer can be a top ten finish and a projected six wins at the same moment.
Frequently Asked Questions
Are college football power rankings meant to predict the national championship?
Only partly. Some rankings describe what already happened (a resume), others estimate what will happen (a forecast). Models like FPI and S and P+ are built to predict game and season outcomes, which is why they are useful for playoff odds. Polls describe consensus opinion, and the playoff committee makes selections under stated procedures rather than by prediction alone.
What is the difference between a power ranking and the AP Poll?
A power ranking is a general term for any ordered list of team strength. The AP Poll is one specific ranking, produced by about 60 sportswriters casting confidential ballots each week. A media power ranking may use a formula, an opinion, or both, and it has no fixed voting body. So the AP Poll is one kind of power ranking, not the equivalent of one.
Why does one computer model rank teams differently from another?
They weight different inputs. Some lean on margin of victory and points per possession, others on efficiency per play such as expected points added. They also differ in how they set preseason priors, how much they discount late-season garbage time, and how they treat non-conference games. Different assumptions about the same season produce different lists without either model being broken.
Are winning percentage and strength of schedule enough to build a ranking?
They are a solid starting point and will beat a raw points table in almost any backtest, but they miss context. Win percentage treats a three-point loss to a great team the same as a loss to a bad one, and neither input measures how a team performed rather than how it scored. Adding a margin of victory term that is capped at a sensible ceiling gets you closer to a usable rating.
When are college football power rankings most accurate?
Late in the season, after enough games have been played that a team has separated from its schedule. Before week three, ratings mostly reflect priors built from last season and recruiting, so they describe expectations. By late November, with full opponent adjustment and eleven games of data, even a simple model produces numbers that track real results closely.
Should fans follow a human poll, a computer model, or a consensus ranking?
Use each for what it is good at. Models project games and season totals. Polls tell you what the people who watch the sport every week think. Consensus rankings reduce noise from any single source. If you want one habit instead of one system, follow a published model for predictions and check it against the AP for sanity, and treat disagreements between them as a prompt to look at the schedules.
Conclusion
Look at the methodology before you look at the position. A ranking that tells you it adjusts for opponent, weights efficiency over raw yardage, and states its inputs is worth reading; one that cannot tell you how it decides anything is an opinion, and should be treated like one.
Rank position on its own tells you very little. Two systems can put the same team in the top five and the middle of the top twenty and both be defensible, because they answer different questions about different time horizons. Check the schedule behind the number, check the recent games behind the movement, and use disagreement between sources as information rather than an insult to your team.