Here is the short version of how passer efficiency rating is calculated. The NCAA divides one weighted formula by passing attempts, so every yard, completion, touchdown and interception feeds a single number that can run well past 150. The NFL and CFL use a different system built from four components capped at 2.375, which is why the two scales top out on opposite ends of what feels normal to you.
I write about Arizona college football most days, and the same question shows up every season from readers who see a quarterback post 198.7 and assume something is broken. Nothing is broken. The college ceiling is a few thousand points above the NFL ceiling, and the formulas are not related.
Table of Contents
What Is the NCAA Passer Efficiency Rating?
The NCAA passer efficiency rating measures how much value a quarterback produces per passing attempt. It is the college sport’s official statistical benchmark, published by NCAA statisticians and used on box scores, broadcast graphics and official rankings all season long.
It is not a measure of overall quarterback quality. A quarterback who runs for 900 yards, scrambles for a first down every drive and never throws an interception can post a mediocre passer efficiency number. The formula only looks at passing, and it does not care whether those passes were forced, puntted or thrown on third and twenty.
Because there is no ceiling in the college formula, records look strange next to NFL numbers. Jayden Daniels’ 208.0 for LSU in 2023 is the FBS single-season mark, and Tua Tagovailoa’s 199.4 career figure across 2017 to 2019 at Alabama still holds as of 2026. Both are enormous numbers with no NFL equivalent.
How Passer Efficiency Rating Is Calculated
The college formula is one line with four weighted terms, and every term is a raw counting stat multiplied by a fixed coefficient before it is divided by attempts. That division is the whole trick. It converts a season’s output into a per-snap rate, so a quarterback with more attempts is not automatically rewarded for a bigger stat line.
The NCAA passing efficiency formula is calculated as:
(8.4 × YDS + 330 × TDP + 100 × CMP − 200 × INT) ÷ ATT
YDS is passing yards, TDP is touchdown passes, CMP is completions and INT is interceptions. ATT is passing attempts, and in college football that number includes times the quarterback was sacked. A sack costs a quarterback an attempt and any lost yardage comes off YDS, so a quarterback taking a lot of sacks is punished twice before anyone argues about his supporting cast.
The weights are doing something specific. Completion percentage is worth a flat 100 points because volume of completions matters more than volume of yards. Touchdowns carry a 330 multiplier, which is roughly 3.3 times a completion, so scoring matters most. Interceptions subtract 200, a meaningful penalty but not a disqualifying one. Yards are worth 8.4 each because they are the softest signal in the formula and the easiest one to accumulate against a soft defense.
How passer efficiency rating is calculated in the NFL and CFL
The NFL and CFL versions convert five stats into four components. Each component is capped at 2.375 and floored at zero, then the four values are added, divided by 6 and multiplied by 100. That produces a 0.0 to 158.3 scale with no relationship to the college formula.
a = (CMP ÷ ATT − 0.3) × 5
b = (YDS ÷ ATT − 3) × 0.25
c = (TDP ÷ ATT) × 20
d = 2.375 − (INT ÷ ATT) × 25
Apply the cap of 2.375 and the zero floor to each one, then divide the sum by 6 and multiply by 100. Because the components subtract a baseline before scaling, a quarterback has to clear 60 percent completions, 9 yards per attempt and a 3.5 percent interception rate just to reach the formula’s neutral zone. That is why a 60 percent passer with clean football usually lands near 85 and not near 100.
| Feature | NCAA passing efficiency | NFL and CFL passer rating |
|---|---|---|
| Structure | One weighted sum divided by attempts | Four components averaged |
| Scale | No ceiling or floor in practice | 0.0 to 158.3 |
| Typical leader | Roughly 180 to 195 | Roughly 95 to 105 |
| Sacks counted | Yes, as an attempt and lost yardage | No |
| Statistically neutral value | Zero, per attempt | 66.7 in 1973 |
The Six Statistics Used in the Formula
Six numbers go into the college calculation, and one of them causes most of the confusion.
Attempts (ATT) sit in the denominator, so they control how strongly every other statistic is weighted. A quarterback who throws 10 times and has a superb completion rate will move the number more than a quarterback who throws 45 times with the same rate, because the same total performance is spread over fewer attempts.
Completions (CMP) contribute 100 points each. Completions are weighted more heavily than yards per attempt on purpose, because a quarterback who keeps throwing short completions is doing something a quarterback who completes half his passes for 3 yards a pop is not.
Yards (YDS) contribute 8.4 each. This is the smallest multiplier of the four, which means raw yardage is the least valuable way to move the number. A 400-yard game on 50 attempts usually produces a lower rating than a 280-yard game on 20.
Touchdowns (TDP) contribute 330 each. Because 330 divided by ATT sets the effective weight, a quarterback who throws five touchdowns in ten attempts scores heavily here, and a quarterback who throws 30 in 500 attempts scores close to nothing.
Interceptions (INT) subtract 200 each. The penalty is stiff enough that a quarterback throwing many interceptions needs an exceptional completion percentage and touchdown total to hold a respectable rating.
Sacks are the sixth statistic, and in the NCAA they are folded into attempts and lost yardage rather than tracked separately. The NFL passer rating ignores sacks entirely. That is one of the clearest reasons an NFL sack total and a college sack total do not translate cleanly onto their respective ratings.
To appear in the NCAA’s official season rankings a quarterback needs at least 20 passing attempts per game, which stops a handful of garbage-time snaps from producing a 300 rating that nobody takes seriously.
Worked Example: Calculating a Passer Efficiency Rating
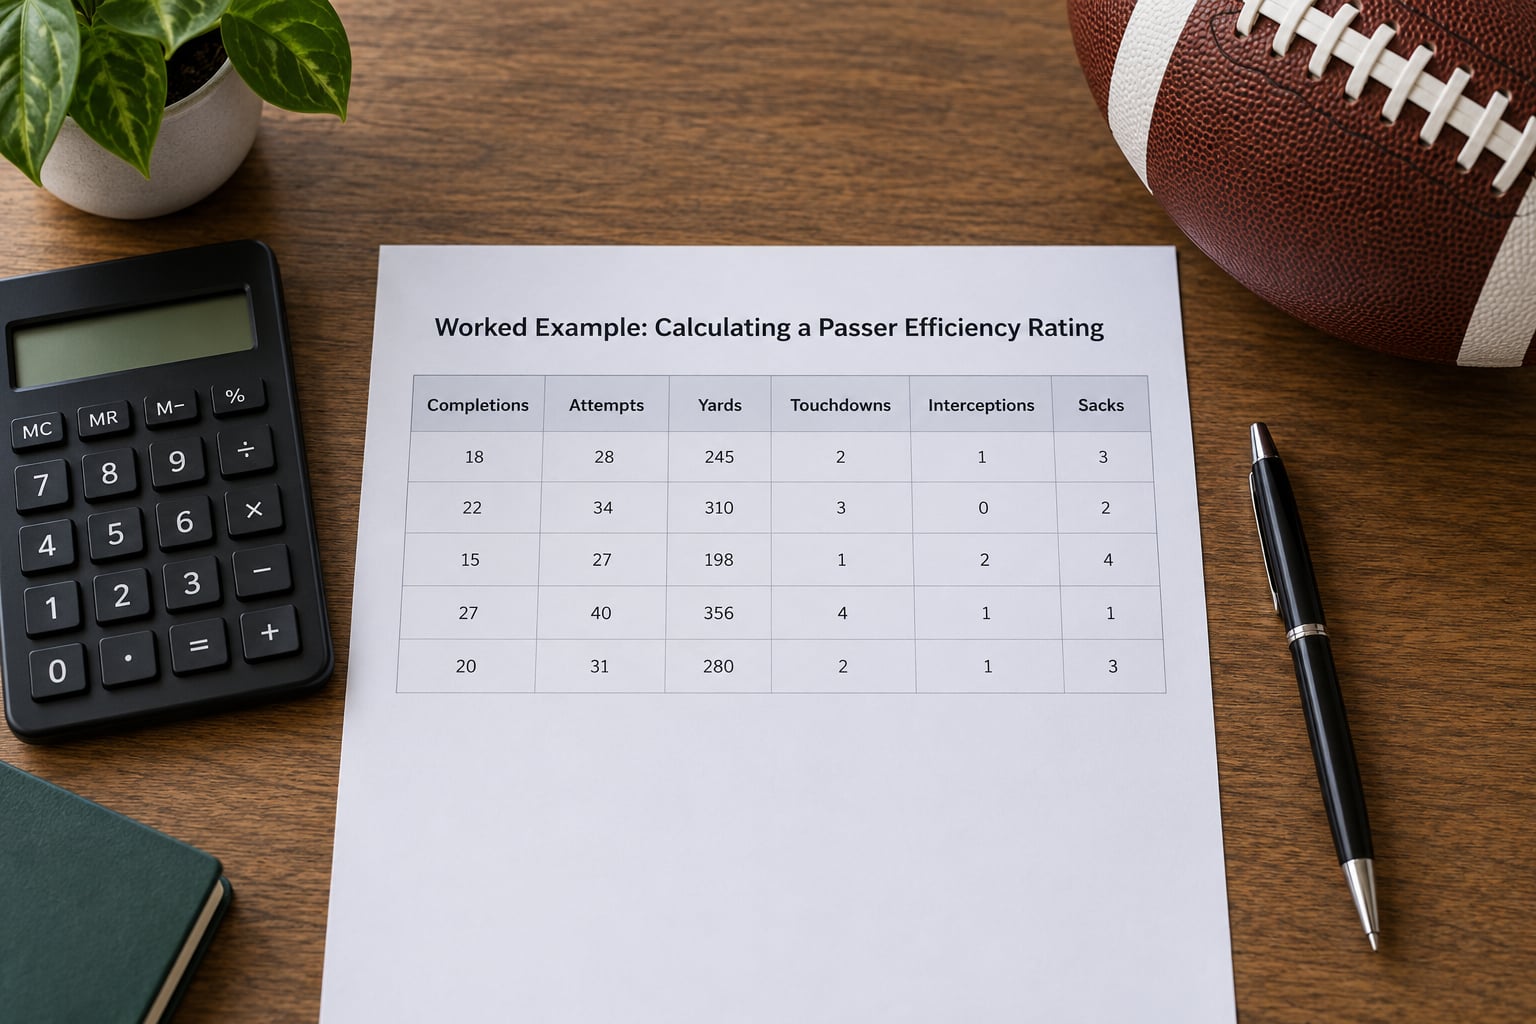
Here is a full college calculation using a plausible stat line: 24 completions on 33 attempts, 305 yards, 3 touchdowns and 1 interception. Plug each term in and the arithmetic is straightforward.
Yards: 8.4 × 305 = 2,562
Touchdowns: 330 × 3 = 990
Completions: 100 × 24 = 2,400
Interceptions: 200 × 1 = −200
Add those together: 2,562 + 990 + 2,400 − 200 = 5,752. Then divide by 33 attempts, which gives 174.3.
Now compare it with a bigger but worse stat line: 26 completions on 38 attempts, 380 yards, 3 touchdowns and 2 interceptions. The yards term rises to 3,192, but the interception term drops to −400 and the attempt total grows. The result is 167.9.
That quarterback threw 75 more yards and completed two more passes, and finished below the other guy. Once you see it worked out on paper, the whole reason the metric exists stops being mysterious.
The same 24-of-33 line run through the NFL formula, by the way, produces components of 2.136, 1.561, 1.818 and 1.617. Summed, divided by 6 and multiplied by 100, that is a 118.9 NFL passer rating. Same numbers, two scales, two completely different-looking results.
How to Read and Compare the Ratings
A passer rating is a rate with a moving baseline, so the first question is always which league and which era. The NFL league average was 61.7 in 1973, when the formula was introduced, and it had climbed to 93.6 by 2020. A 90 rating meant something entirely different in those two years.
The practical read is simple. In a modern NFL season, anything under 75 is genuinely poor, 85 to 95 is solid starter work, above 100 puts a quarterback in MVP conversation and above 110 is elite. In college, a team quarterback finishing a season under 130 is struggling, and 170 to 190 is what a first-round prospect looks like against a good schedule.
Volume creates its own profile. A quarterback with 40 attempts and a 130 rating may be far better than a quarterback with 45 attempts and a 95, or the reverse. Rating rewards precision, volume punishes it, and comparing across attempt totals without acknowledging that is how arguments get started.
The metric also ignores the parts of the job that decide games. Sacks, fumbles, rushing, pressure rate, field position, opponent quality and fourth-down decision making all sit outside the formula. That is why passer rating and ESPN QBR routinely rank players in different orders. QBR weights expected points added per dropback, which naturally includes yards gained after the catch and context, so a quarterback with a slightly lower passer rating can post a much higher QBR in the same season.
Pro Football Focus grades take a different path again, treating every play as its own expectation value and grading execution on a 0 to 100 scale. Treat the three as three cameras pointed at the same game rather than as competing verdicts.
Frequently Asked Questions
How is the NCAA passing efficiency rating calculated?
Divide a weighted sum of four stats by passing attempts. Add 8.4 times passing yards, 330 times touchdown passes and 100 times completions, then subtract 200 times interceptions. That total divided by attempts gives the rating. Sacks count as attempts in college football, and there is no ceiling or floor on the result.
What is a good college passing efficiency rating?
It depends on the era and the schedule. In the modern game, a quarterback finishing between 170 and 190 is performing at a first-round prospect level, above 195 is exceptional and above 200 is historic. Anything under 130 for a full-time starter usually means the offense is struggling. Always compare against the season average rather than an NFL-style scale.
Why is 158.3 the highest passer rating possible?
Because each of the four NFL components is capped at 2.375, and 2.375 times 4 divided by 6 multiplied by 100 equals 158.3. Reaching it needs roughly a 77.5 percent completion rate, at least 12.5 yards per attempt, a touchdown every 8.4 attempts and zero interceptions, which is why the figure is not a rounded number and why perfect games are rare.
Has anyone ever had a 0 passer rating?
It takes a specific line rather than a terrible one. The completion percentage must be 30 percent or lower, yards per attempt 3 or lower, no touchdowns and an interception rate of at least 9.5 percent. Three completions on 10 attempts for 30 yards with no touchdowns and one interception produces exactly 0.0. A quarterback with attempts and zero completions still gets 39.6.
Is a 72 passer rating good?
In a modern NFL season, no. The league average sat above 90 through the 2020s, so 72 is well below what a starter produces in an average year. A 72 was an excellent number in the 1970s and early 1980s, when the league average was closer to 65. This is the era trap in one number, and it is why raw ratings from different decades should not be compared directly.
Why does the league average passer rating keep rising?
Passing is more efficient than it was, and the formula rewards that. Completion percentages have climbed, yards per attempt have grown with the spread of the passing game, and two-minute and fourth-down aggression creates low-risk throws. The baseline shifted from 61.7 in 1973 to 93.6 by 2020, so absolute ratings drift upward and only comparisons within the same season are clean.
Next time a box score shows you a number, pull the five stats out and run them yourself. In college, weight the line by 8.4, 330, 100 and 200 and divide by attempts. In the NFL, build the four components, cap them at 2.375, and divide the sum by 6. Ten minutes of arithmetic explains more about quarterback performance than any highlight reel.