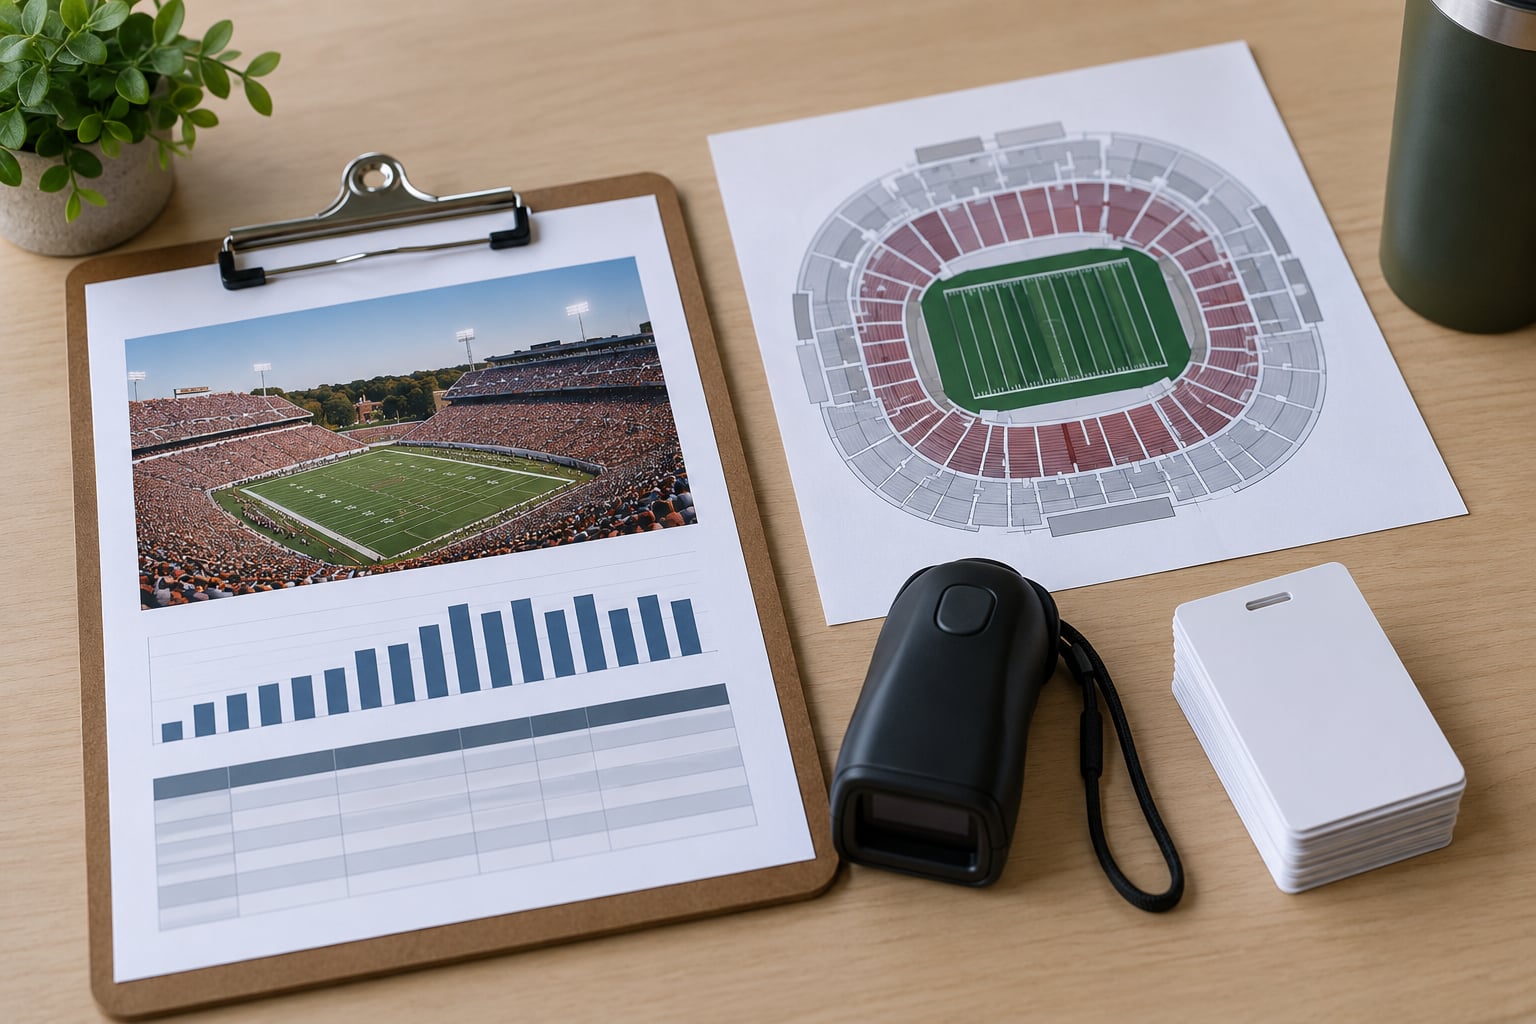
How college football attendance is counted comes down to two different numbers, and the two rarely match. The figure schools report to the NCAA and announce over the public-address system comes from tickets paid for and distributed, not from fans actually scanned through the gate. A turnstile count of people who really walked in usually sits well below it.
That gap is the whole story, and it explains why a stadium can announce a number matching its official capacity while thousands of seats sit empty. Here is how the reporting works, who is responsible for it, and how to find the scan-based figures that most schools never publish.
Table of Contents
- What Does College Football Attendance Measure?
- How College Football Attendance Is Counted at the Stadium
- Who Reports Attendance to the NCAA?
- What Is the Difference Between Paid Attendance and Total Attendance?
- Why Do College Football Attendance Numbers Sometimes Differ
- How the NCAA Uses Attendance Records
- Frequently Asked Questions
- Is NCAA attendance the same as the number of people inside the stadium?
- How does a football stadium count attendance with turnstiles?
- Does complimentary attendance count in college football statistics?
- Why can two sources report different attendance for the same game?
- Does a sold-out stadium always mean every seat was occupied?
- Where can readers find official NCAA college football attendance records?
- Conclusion
What Does College Football Attendance Measure?
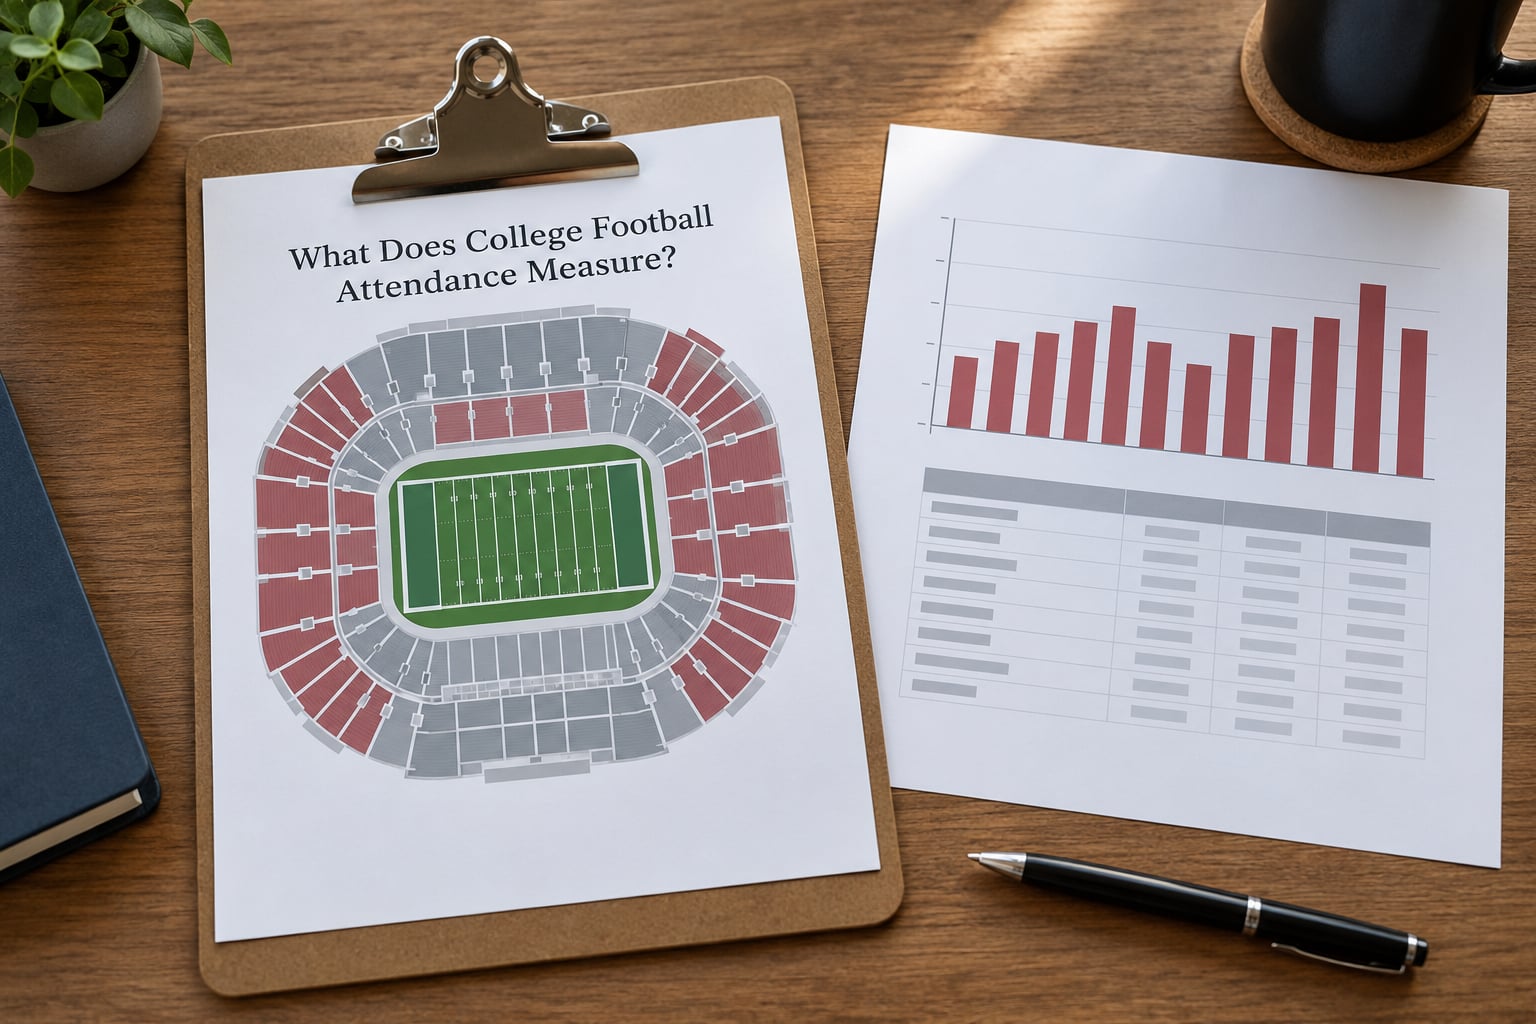
Attendance measures ticketed spectators for a game, which is a different thing from counting bodies in seats. The NCAA asks schools to report tickets paid for, and schools follow a ticketing convention that also sweeps in complimentary tickets, student credentials, media credentials and game-day staff. The result is a ticketing metric, not a headcount.
The vocabulary matters here, because schools, reporters and fans frequently use these terms as if they were interchangeable. They are not.
| Term | What it means |
|---|---|
| Announced attendance | The number read over the PA system and reported to the NCAA. Built from tickets paid for and distributed. |
| Paid attendance | Tickets actually sold for cash, including season ticket payments received and single-game purchases. |
| Tickets distributed | Paid tickets plus complimentary tickets and credentials issued for a game. |
| Turnstile count | The physical count of people passing through gates or scanners at the stadium. |
| Scanned-in attendance | The venue’s scan figure, usually compiled from ticket scanning data before or during the game. |
| No-show rate | The share of distributed tickets that were never scanned in. |
| Percent of capacity | Attendance divided by the stadium’s official seating capacity, expressed as a percentage. |
| Sellout | Every ticket for a game sold or distributed. It says nothing about how many seats were occupied. |
| FBS | Football Bowl Subdivision, the NCAA division with its own attendance requirement. |
One more term deserves attention: percent of capacity filled. Researchers and reporters working on this question tend to trust it more than raw attendance, because it normalizes for stadium size. A 60,000-seat stadium at 92 percent filled is a fuller building than a 30,000-seat stadium at 95 percent of capacity on paper.
How College Football Attendance Is Counted at the Stadium
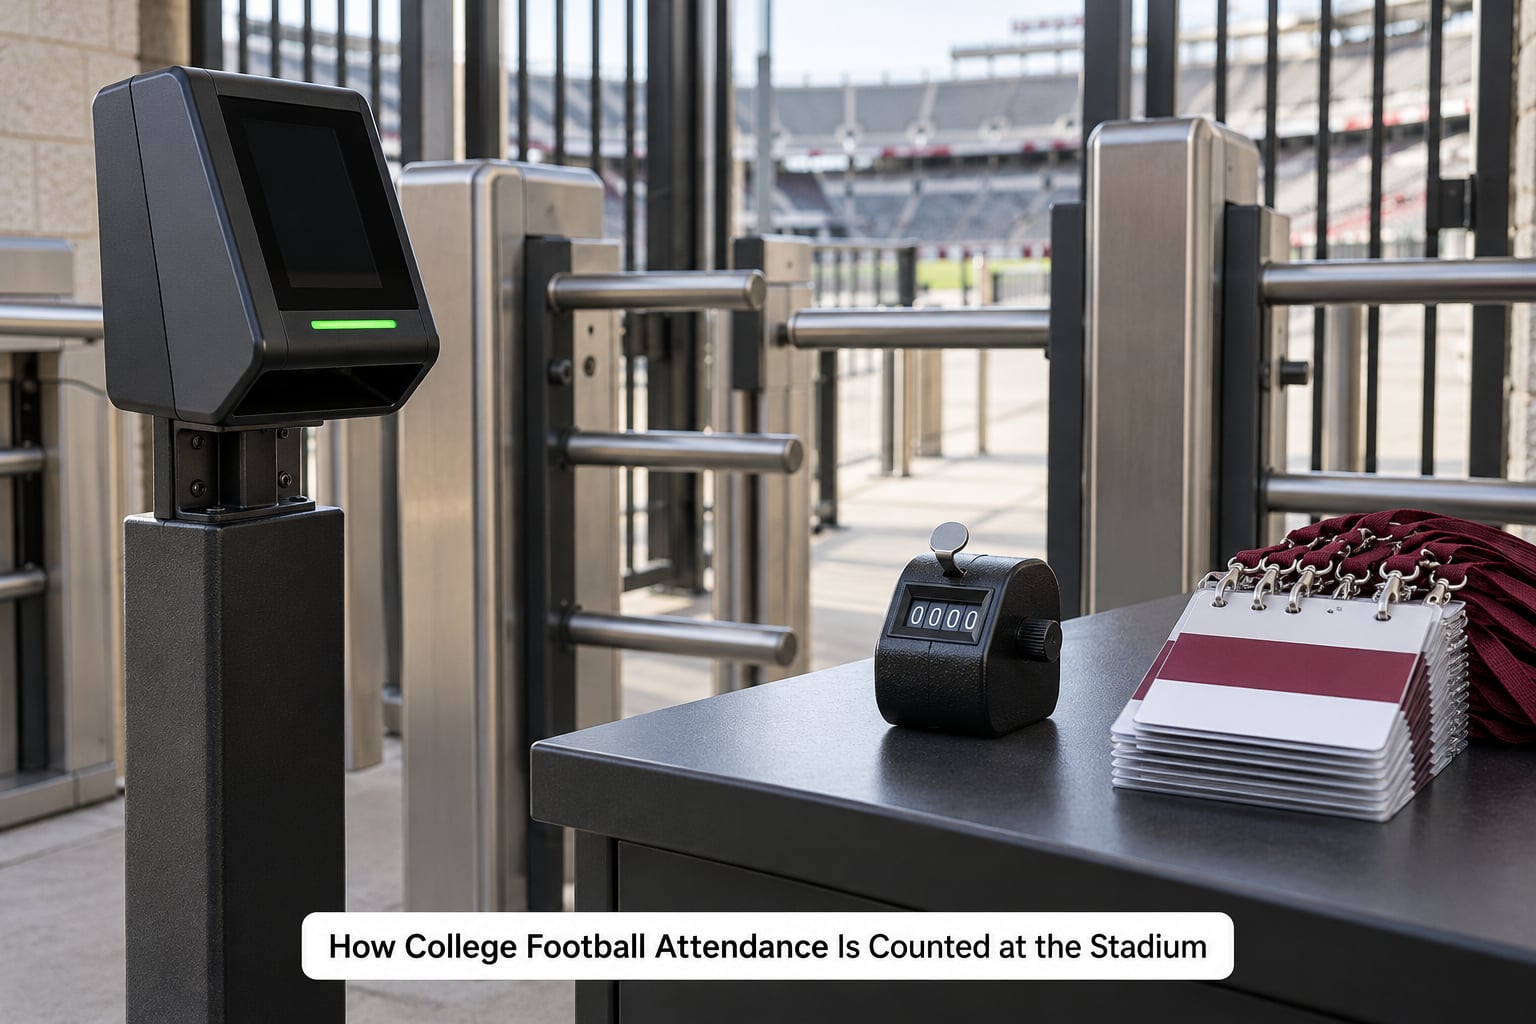
Every stadium runs its own version of this process, but the steps underneath are consistent enough to walk through. The ticketing side produces the official figure, and the gate side produces the scan figure, and the two are compiled by different teams that rarely speak to each other.
- Tickets are distributed. Season tickets, single-game sales, complimentary tickets, student tickets and credentials are issued for the game. This total becomes the backbone of the reported number.
- Gate sales are added. A limited amount of inventory is usually held for will-call and gate sales, and those purchases get added to the distributed figure.
- Scanners run at every entry point. Physical gates and turnstiles count people as they enter. On mobile ticketing systems, a scan at the gate or at the seating portal is the equivalent of a turnstile count.
- The scan window closes. Gates shut near kickoff. The scan total is compiled from the ticketing system, usually by a game operations staffer or an athletics business office employee, and reconciled against will-call and sales reports.
- The number is certified internally. A person in the athletic department signs off on the official figure that goes to the conference and the NCAA.
- It is announced over the PA system. This is the figure most fans hear, and it is the paid-and-distributed total rather than the scan total.
- It lands in the NCAA box score. The home team submits it as part of the official game report, and it is published in NCAA statistics where it feeds averages and rankings.
Scan data is the part almost nobody sees. A venue may calculate a scan count on gameday and still never release it, which is why the announced figure is the only number most people have ever encountered.
What the number is not
Three misconceptions come up constantly, and each one distorts the conversation.
- It is not a headcount of people in seats. Nobody walks the stadium counting fans. That work is not done at any college venue.
- It is not stadium capacity. A number can exceed the official seating capacity because credentials, staff and complementary categories sit outside the seats.
- It is not simply tickets printed or tickets sold. Schools add complementary categories on top of paid sales, which is how announced totals drift past the number of seats available to paying fans.
Who Reports Attendance to the NCAA?
Reporting starts with the home athletic department. That group compiles the paid and distributed figure for the game, certifies it internally and submits it to the conference after the contest. The visiting team has no vote in the number, which is why attendance is treated as a home-team metric.
Conferences collect those submissions and pass them upward, and the NCAA is the body that maintains the national record and publishes the game-by-game statistics and season averages that show up in rankings. When people ask where the official college football attendance record lives, the answer is the NCAA’s published statistics, fed entirely by what home teams submit.
There is one substantive NCAA requirement layered on top of that reporting chain. FBS programs have to show a rolling average of 15,000 paid or actual attendance per home game to remain in the subdivision. The “paid or actual” language lets a school satisfy the requirement with either figure, which is part of why the bylaw has drawn attention from fans looking for a stricter standard.
What Is the Difference Between Paid Attendance and Total Attendance?
Paid attendance is the money side: tickets that were actually purchased and paid for, including season ticket payments the school received. Total attendance, or announced attendance, is broader. It takes the paid figure and adds complimentary tickets issued to students, faculty, donors, corporate partners and others, plus media credentials and the credentials for game-day staff and participants who are not sitting in a seat.
The additions are legitimate parts of a gate count in a broad sense, but they are not spectators in the stands, which is exactly why an announced total can sit above official stadium capacity without anybody fabricating anything.
A school that announces its full seating capacity every home game may be doing nothing more than following the convention. Iowa’s Kinnick Stadium announced exactly 69,250 for all seven of its 2023 home games, according to a News-Gazette open-records investigation covering the 2023 season. In that same reporting, scanned-in counts for those games ranged from 42,002 to 51,143. Both numbers are real measurements. They just measure different things.
Season tickets make this messier. A season ticket holder who never attends is still counted, because the ticket was paid for at the start of the year and the school has no way to subtract one person’s absence from a season total without rescanning every single one of those tickets. That is why sellout streaks stay intact even in seasons with heavy no-shows. Nebraska’s streak of consecutive sellouts dates to 1962, and the same 2023 open-records reporting showed gaps above 20,000 fans between announced and scanned figures in several games.
Why Do College Football Attendance Numbers Sometimes Differ
Turnstile scans and announced figures are different measurements of the same event, so they diverge for mechanical reasons. Some divergence is normal. The size of the gap varies widely by program, and the spread itself is the useful signal.
The largest documented dataset comes from FOIABall, which obtained scan data from 55 public FBS schools covering 353 games in the 2025 season. It found that 28.4 percent of distributed tickets went unused, with 15.4 million announced attendance across those games against 11.0 million scanned in. Within the Big Ten, Michigan showed the smallest gap at 13 percent and Maryland the largest at 39 percent. Toledo had the largest gap of any school in the sample at 68 percent.
That sample is worth reading carefully. It is self-selected public schools, Penn State, Indiana and Purdue did not provide data, and only four SEC schools responded. Read the direction of the finding rather than treating it as a census.
| Program | Season | Announced | Scanned or actual | Gap | Source |
|---|---|---|---|---|---|
| Iowa | 2023 | 69,250 every home game | 42,002 to 51,143 per game | Roughly 22 to 39 percent | News-Gazette open records |
| Illinois | 2023 | Up about 6,650 per game year over year | Up about 1,190 per game | Reported figures rose at very different rates | News-Gazette open records |
| Nebraska | 2023 | Sellout streak since 1962 | Gaps above 20,000 in several games | Not stated as a percentage | News-Gazette open records |
| Michigan | 2025 | Big Ten sample | Smallest Big Ten gap in study | 13 percent | FOIABall scan study |
| Maryland | 2025 | Big Ten sample | Largest Big Ten gap in study | 39 percent | FOIABall scan study |
| Toledo | 2025 | Full FBS sample | Largest gap in the study | 68 percent | FOIABall scan study |
| California | Scan spreadsheet | Tickets sold per game with 69.9 to 93.8 percent of them scanned in, from a shared ticket-scanning spreadsheet | |||
One caution about the 2023 open-records table: it lists Indiana’s October 21 game against Rutgers with an actual figure of 223,643, which is impossible for a stadium with a 52,626 capacity. It is a transcription error. Treat every number from a published table as something to sanity-check against capacity before you repeat it.
Beyond no-shows, several other things move the figures apart.
- Distributed tickets that nobody uses. The dominant cause. Season ticket holders, complimentary recipients and student section gaps all show up here.
- Credentials. Media, staff and participant credentials are often counted in the announced total but are not seated spectators.
- Late arrivals. A student section that fills in during the second quarter may or may not be captured, depending on when the count is locked.
- Duplicate or corrected scans. Mobile tickets shared between people can produce errors in either direction.
- Capacity limits and capacity creep. A stadium’s official capacity figure is itself a published number that can change with seating changes, which is why a number over 100 percent of capacity is not automatically an error.
- Different definitions. Some venues report scans, some report distributed tickets, and some report a hybrid. Cross-sport confusion makes this worse, since basketball arenas frequently use a different convention than football stadiums.
- Reporting lag and corrections. Figures get filed weeks after the game and sometimes get revised.
One widely circulated forum example captures how sharp this can look: at one Mountain West venue, only 25,493 ticketed fans were counted at the gates, roughly 36 percent below the announced attendance and about half the stadium’s capacity. A gap that size is not rounding error.
How the NCAA Uses Attendance Records
Once submitted, the home team’s figure travels into NCAA statistics, where it feeds season averages, per-game rankings and school profiles. Because those averages are built from announced figures, the entire public record inherits the ticketing convention. Any ranking that claims to compare crowds across schools is really comparing ticketing practices.
The FBS 15,000 paid-or-actual bylaw is the clearest example. It is a rolling average across home games, it accepts either the paid figure or the actual figure, and a program can clear the bar without a scan ever appearing in an NCAA document. Fans who want a stricter rule have to wait on the bylaw, not on the statistics.
The number also reaches places with real consequences. Bowl selection formulas during the BCS era included a five-year attendance average for the game, a component sometimes called FiveAtt, which meant ticketing practices could shape postseason placement. Conferences weigh attendance when discussing expansion and realignment. Television partners use it to plan broadcasts and inventory. And because attendance is visible and easy to chart, it turns into pressure on coaches long before the wins and losses do.
None of that makes the reporting rule dishonest. It makes it a convention with real downstream effects, which is a different and more accurate complaint than cheating.
How to find the real numbers yourself
Scan data is public record material in most states, and almost nobody requests it. If you want to know how full a stadium actually was, you can do this.
- Start with the state’s public records statute. Most states have a version of the federal Freedom of Information Act with its own agency and timeline.
- Write to the athletic department’s business office or records officer. Ask specifically for turnstile or scanned-in counts by game for recent home seasons, alongside the announced figures.
- Keep the request narrow. A request scoped to one or two seasons gets answered faster than one covering a decade.
- Ask for the underlying ticket file if the counts are refused. A CSV of tickets distributed with scan status is more useful than a summary figure.
- Publish what you get. The 2023 Big Ten open-records project only happened because the requests and the responses were public.
Public datasets also help. There are open college football attendance datasets built game by game from NCAA statistics back to the early 2000s, and they are useful for trend lines. They are built from announced figures, so they measure ticket distribution rather than bodies in seats. For a single game, the only reliable route to how college football attendance is counted in reality is the records request above. Keep that distinction in view while you read them.
If you are curious how the convention reads at other levels, the National Football Foundation’s season summaries are a reasonable place to see announced totals compiled across the sport, and they come with the same caveat attached.
Frequently Asked Questions
Is NCAA attendance the same as the number of people inside the stadium?
No. The NCAA figure schools report is built from tickets paid for and distributed, which includes complimentary tickets, credentials and staff access. The number of people physically inside the building is a separate scan or turnstile count that most schools do not publish. Both are legitimate measurements of the same game, and in most seasons they differ substantially.
How does a football stadium count attendance with turnstiles?
Fans pass through gates or turnstiles where a physical counter or a ticket scanner registers entry. On mobile ticketing systems, a scan at the gate or seating portal serves the same purpose. The gate count is compiled by game operations staff from the ticketing system, typically after the gates close near kickoff, then reconciled against sales reports before anyone certifies a final figure.
Does complimentary attendance count in college football statistics?
Yes, generally. The reported figure is normally paid attendance plus complimentary tickets and credentials issued for the game. Because those complementary categories include media, staff and other credentialed people who are not seated spectators, the announced number can exceed a stadium’s official seating capacity without any irregularity occurring.
Why can two sources report different attendance for the same game?
One source usually reflects tickets paid for and distributed, and the other reflects tickets scanned at the gate. Reporting lag, credentials, capacity limits, duplicate scans and different definitions used by each venue add more distance. Watch for published tables that carry errors, since one widely shared 2023 open-records table lists an actual figure larger than the stadium’s capacity.
Does a sold-out stadium always mean every seat was occupied?
No. A sellout means every ticket for the game was sold or distributed. Season ticket holders who do not attend are still counted, and complimentary tickets may never be claimed. Sellout streaks can therefore continue for decades while the scanned-in crowd runs thousands below the announced figure.
Where can readers find official NCAA college football attendance records?
NCAA statistics is the national record, and every figure in it comes from the home athletic department’s submission after the game. Conference offices pass those submissions upward. Publicly available game-by-game datasets are useful for trends, though they carry announced figures rather than scan counts, which usually require an open records request to a specific school.
Conclusion
How college football attendance is counted comes down to this: the game is counted twice, and the number you hear is the ticketing one. The process runs from ticket distribution through gate scanning to a certified figure that the home athletic department submits to the conference and the NCAA, and it measures tickets accounted for rather than people seated.
When you judge whether a game was genuinely full, start with the official figure, then divide it by the stadium’s capacity and look for the scan count or percent of capacity filled. If a program publishes neither, an open records request is the only reliable route to the real number, and few fans have ever sent one.