College football analytics changed fourth down calls by turning every decision into a priced comparison: punt, field goal, or conversion attempt, each assigned an expected value in points or win probability. Instead of punting by reputation or punting because field position looks dangerous, coaches now call the option with the highest expected value and adjust for the live situation. The shift is measurable, and in 2026 almost every program has an analytics department feeding a fourth down chart to the sideline.
The most visible part of the change is that punting is no longer the default. Teams punt from midfield, punt on fourth-and-1, punt inside field goal range when the kicker is unreliable, and sometimes fake the punt rather than run it. That only happens once somebody in the building prices each option in expected points and shows the head coach the gap.
Table of Contents
- What Changed About College Football Fourth Down Decisions?
- How Win Probability Models Improve Fourth Down Calls
- Which Metrics Matter Most?
- What Context Did Analytics Add to Raw Numbers?
- What Is the Analytics-Informed Fourth Down Process?
- Why Analytics Still Cannot Make Every Call Correct
- Frequently Asked Questions
- When should a college football coach go for a fourth down?
- Is the fourth-down conversion rate the most important number?
- When is punting still the analytically favorable choice?
- How do college football win probability models differ from professional models?
- If an aggressive fourth-down call works, was it necessarily the right decision?
- Conclusion
What Changed About College Football Fourth Down Decisions?
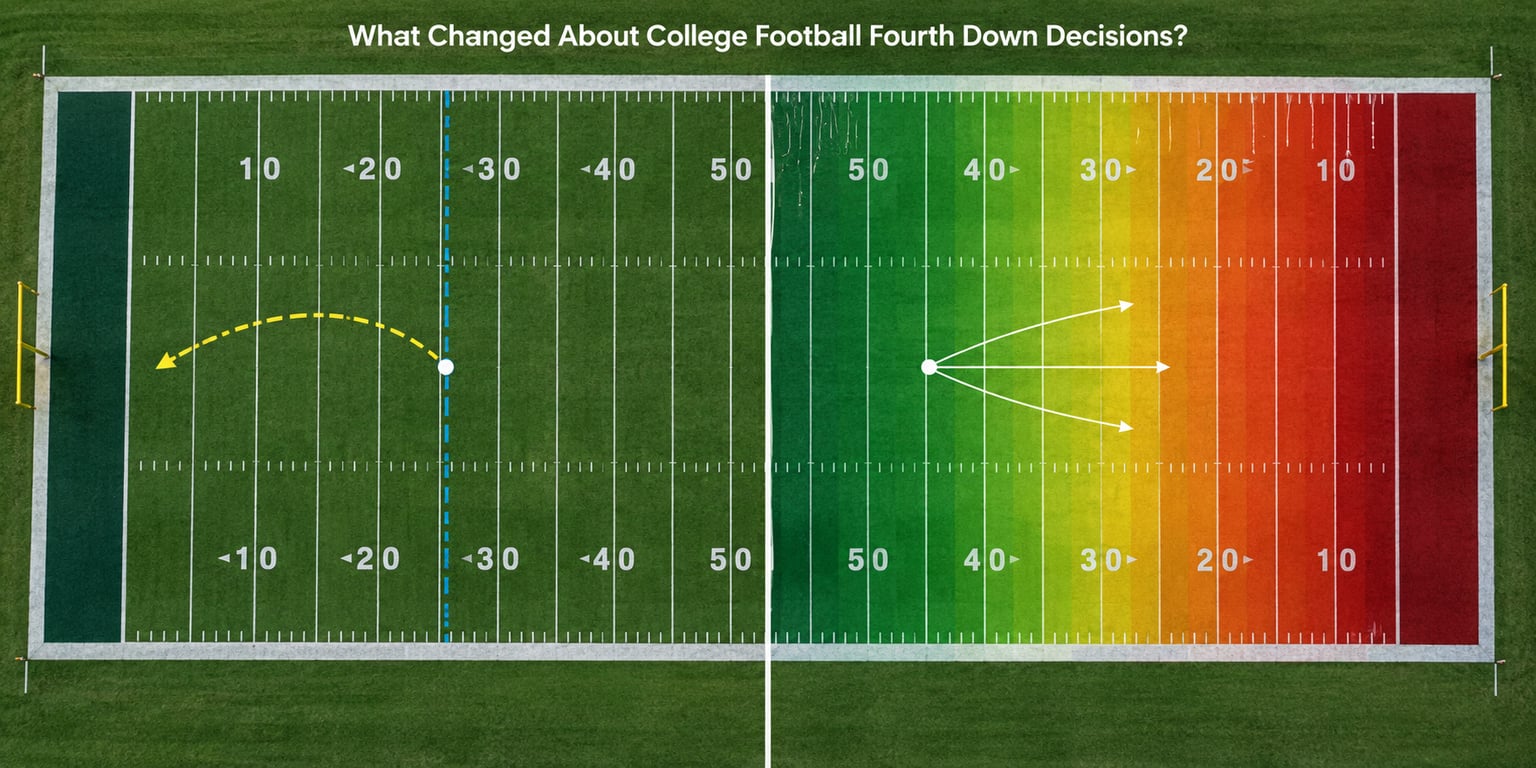
Modern fourth down analytics changed college football calls by treating every fourth down as a probability decision rather than a football decision. Coach reputation, which distance looked safe, and what the previous staff did used to settle it. Now the question is which option adds the most expected value given the score, the clock, the spot, and the personnel on the field.
| Factor | Traditional reasoning | Modern analytics input |
|---|---|---|
| Primary goal | Flip field position and stay safe | Maximize expected points added on this snap |
| Default on fourth and 3 at midfield | Punt | Go for it in most spots |
| Field goal evaluation | Are we in range | Make probability by distance minus kickoff value |
| Kicker quality | Rarely discussed | A first-order input that can flip the call |
| Time remaining | Used to justify punting to end the game | Fed directly into the win probability model |
| Purpose of the call | Avoid the risky look | Accumulate a small edge across many calls |
One thing worth being precise about: the analytics did not make football more aggressive everywhere. They made aggression selective. A generic model now says go in spots that used to be automatic punts, and it says punt in spots that felt obvious to attack, like fourth-and-1 deep in field goal range with a reliable kicker and an excellent punter.
How Win Probability Models Improve Fourth Down Calls
A win probability model assigns every situation a single number: the chance that team wins the game from this spot, right now. It is built from play-by-play history, adjusted for the score, time remaining, down and distance, field position, and a home field adjustment for the team playing in front of a crowd.
When a coach calls for it on fourth and 3, the model produces a new state: first down at the opposing 47, whatever is left on the clock, and the opponent taking over. That new state gets its own win probability. The difference between the two numbers is the win probability added by the attempt.
Here is the part that surprises people. Going for it can be the higher-value choice even when the team converts less than half the time. If a failed attempt leaves the team in a genuinely bad state and a successful attempt leaves it in a genuinely good one, a 45% conversion rate can still beat a punt that simply hands the opponent good field position.
The reverse holds too. A punt that reliably pins an opponent near their own goal line has more value than its yardage suggests, and a 60% conversion rate deep in your own territory with a backup kicker may be worse than the alternative.
What the model cannot do is tell you a call was right. It tells you the probability you were choosing correctly at the moment of decision. In a forum sense, the most repeated frustration in r/CFB threads is exactly this gap: fans grade the play, and the model graded the decision.
Which Metrics Matter Most?
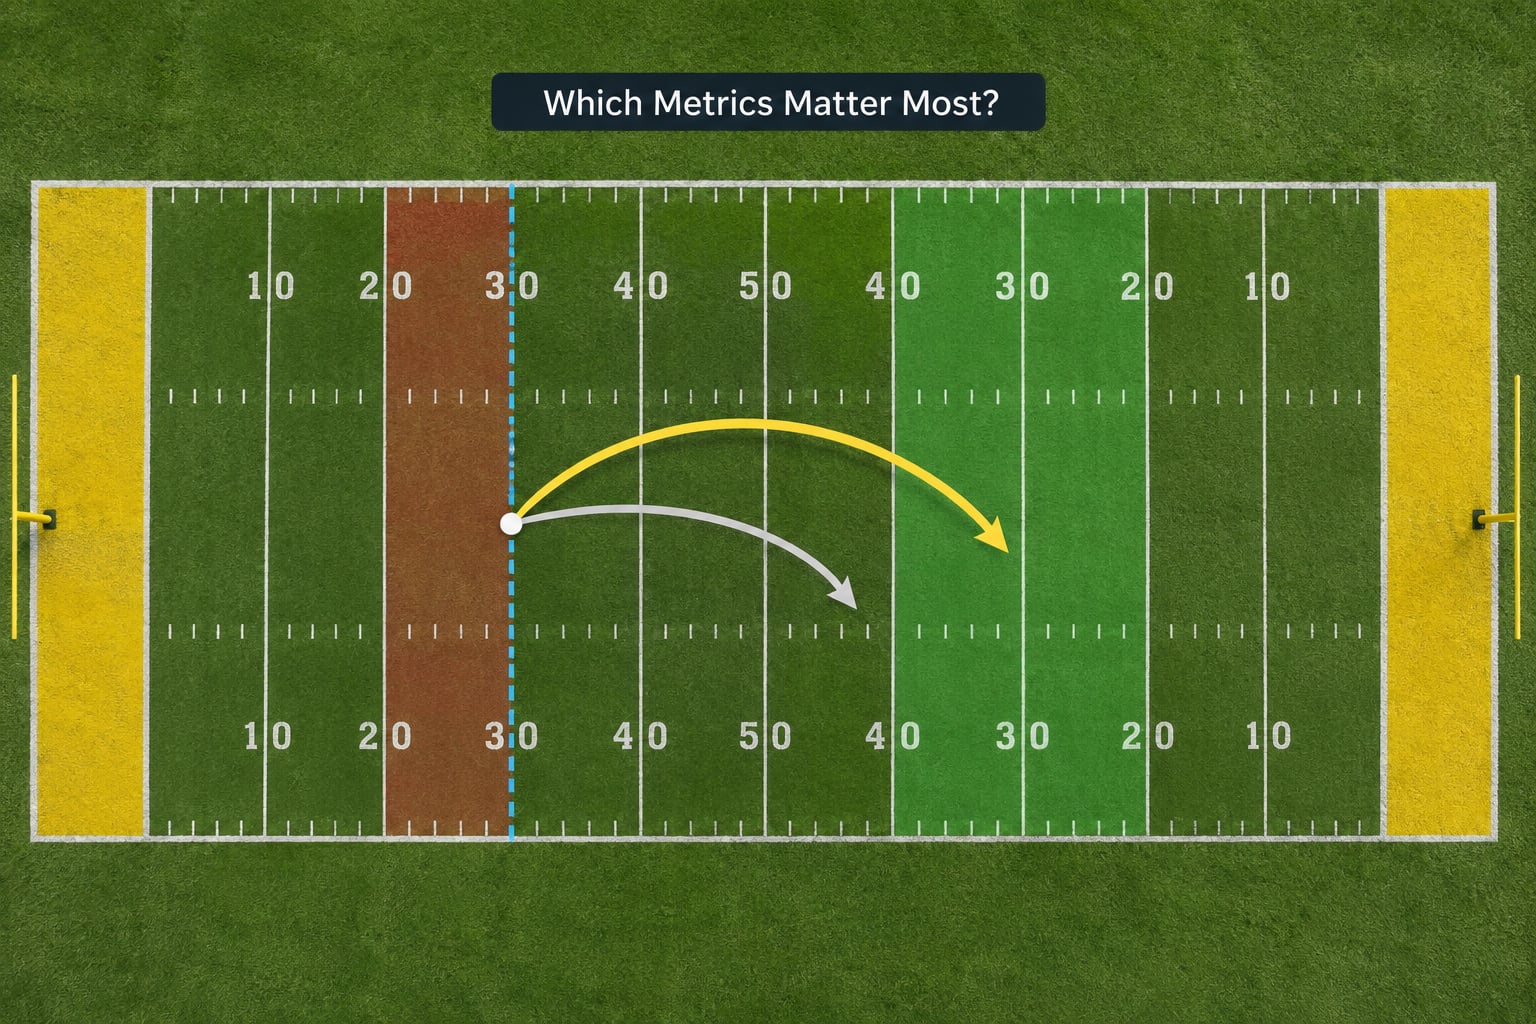
Five metrics do most of the work, and each one answers a different question about the decision in front of you. A good chart shows all of them rather than a single conversion percentage.
| Metric | What it estimates | How it informs the call |
|---|---|---|
| Expected points (EP) | Points a team will score from this field position, averaged across future drives | Values all three options on one scale |
| Expected points added (EPA) | EP after the choice minus EP before it | Shows whether the decision was a net gain |
| Success probability | Chance of converting, by distance and situation | Feeds the conversion side of the comparison |
| Field position value | EP of the spot the opponent inherits | Quantifies what a punt actually buys |
| Drive expectancy | Share of drives from this spot that end in a score | Captures the value of extending drives |
| Win probability added | Change in win probability from the choice | Removes the score and clock from the equation |
Brian Burke’s expected points method on advancedfootballanalytics.com is still the clearest public write-up of the arithmetic. A punt from your own 40 nets roughly 37 yards and hands the opponent a ball near their own 23, which is about minus half an expected point against you. That is what a punt is worth, and it is a small number compared to what fans assume.
A field goal is priced the same way. From the 20, a kick worth about 82% gives you roughly 2.3 expected points net of the ensuing kickoff, and the arithmetic comes out near 1.8 expected points. Multiply that by make probability and you have the real value of kicking, which is why a bad kicker or a bad angle changes the answer.
Success probability alone is not enough, and the table above shows why. A 70% conversion rate means nothing about whether the resulting first down is at the opponent 30 or the opponent 45, and nothing about what a failed attempt does to the rest of the game.
What Context Did Analytics Add to Raw Numbers?
A league-average model tells you the baseline. The adjustments tell you whether this particular Saturday is different from the baseline. Game state, opponent quality, personnel availability, recent tendencies, field surface, weather, score margin, and time remaining all move the recommendation.
How Do Fourth Down Numbers Challenge Conventional Thinking?
The most repeated version of conventional wisdom says coaches go for it when they need the yardage or when the conversion rate is high. Analytics says the yardage need and the conversion rate are two inputs, and neither one decides the call by itself.
Consider fourth and 4 with two minutes left in the first half, tied game, good field goal range, and a kicker who has missed three of his last six attempts. The kick has a lower value than the kicker’s name suggests. Going for it is a reasonable call even though a 50% conversion rate is worse than the punting team’s survival rate.
Now consider fourth and 4, third quarter, up 17, ball on the opponent 20, punter who has held opponents inside the 20 on most of his punts. The same conversion rate no longer justifies going. The field position value of a good punt has risen, and the downside of a failed attempt has shrunk because the opponent is already deep in its own territory.
How Personnel and Situational Football Shape the Call
Personnel is the biggest adjustment a coaching staff makes. An offense with a reliable short-yardage runner going into fourth and inches is a different offense than the same offense calling a pass. A punter who has pinned opponents inside the 20 raises the value of every punt in the game.
Defenses matter too. An opponent that gives up third-and-short at a low rate and forces long yardage is a reason to punt on fourth and 3, not a reason to go. Weak kick coverage units work the other direction: if the opponent has allowed returns and its coverage team has struggled, the expected value of a punt drops.
The Utah case from the Utah-BYU rivalry is the cleanest public example. Utah repeatedly went for it against BYU rather than kicking, and coach Kyle Whittingham pointed at his freshman kicker, Dillon Curtis, whose practice and game attempts had been inconsistent. On a fourth-and-7, his staff put the numbers at roughly 45% for the kick against 43% for the attempt. Analytics plus judgment, in his framing, and he was open about both inputs on the record.
Where Analytics Still Says Punt
Three situations reliably pull the model toward punting, and fans rarely hear about them because a punt that works generates no highlight. An elite punter with strong coverage. An opponent defense that is genuinely good at field position. And a field goal spot where your kicker is a downgrade from your punter.
Add a fourth case that coaches describe often: a fourth down where going for it helps the opponent more than a failed attempt hurts you. Whittingham put it plainly in the Utah discussions, noting that a field goal can be a net loss in the red zone, because ending a drive deep in opponent territory with three points gives up a possession that could have produced seven.
What Is the Analytics-Informed Fourth Down Process?
The practical sequence is short, and it runs the same way on fourth-and-2 in the third quarter as it does in the two-minute drill before a season opener. Understanding how college football analytics changed fourth down calls means understanding this sequence, not just the numbers in it.
- Establish the baseline. Pull the league decision chart for that distance, field position zone, and quarter, and read off the recommendation.
- Update the game situation. Apply score, time remaining, home field, and whether this is a one-possession game.
- Compare going and punting value. Put both options in expected points, then convert to win probability added so the choice is expressed in terms of winning.
- Apply situational adjustments. Kicker reliability, punter quality, coverage team, weather, surface, and opponent tendencies.
- Communicate the risk. State the number out loud so the head coach hears the number and not just the recommendation.
- Document the result. Log the recommendation and the actual call separately from the outcome.
Two practical notes on how this works on a Saturday. There is no live model running on the sideline with a live internet feed, so most programs use a pre-built fourth down chart or binder that was generated before the game and printed for specific situations. And the recommendation is information, not an order. Mike Elko has described his version of that arrangement bluntly, saying the decisions are made by him.
The Mike Lopez point about the professional game is worth borrowing for college. On the Football Figures transcript, he described the analytics changing fourth down decisions as the most transformative shift in the sport over roughly a decade, with a new record for fourth-down aggressiveness set every single year. College programs now move on the same curve, just a few years behind it.
Why Analytics Still Cannot Make Every Call Correct
Data quality is the first limit. College football has far less public play-by-play than the NFL, and no equivalent of Next Gen Stats tracking data at scale. Most models applied to college were trained on professional data and adjusted for college. That is a real transfer problem, not a technicality.
Model assumptions come next. A model built on league-average punt outcomes cannot know that your punter hangs it on a bad angle, and a model built on kicker make rates treats two kickers with identical college stats as identical even when one is a true freshman.
Sample size bites hardest on kickers. A true freshman might have six attempts, and six attempts produce a number that swings hard on contact. Roster turnover does the same thing to conversion rates, because a new offensive line and a new quarterback produce a different offense in October than the one the chart was built on in August.
Opponents adapt. Once the tendency is public, the defense that gave up third-and-short changes what it gives up. Weather, officiating crew tendencies, and sudden injury or fatigue are all in the category of things a pre-built chart will never capture.
And then there is the part that is not a data problem at all. Football has a philosophy, and the philosophy says a punt protects your defense and preserves your field position identity. That argument may be worth less than the model’s arithmetic, but it is a real preference held by real coaches. Mike Lopez and other NFL data executives have framed expected value as the correct standard, which is a position, not a proof.
Finally, the accountability asymmetry that shows up in every Quora and Reddit thread on this topic: the coach gets blamed for the call, not the players who missed the block. A decision can maximize expected value and still be the wrong career move, and pretending otherwise does not help anyone reading the chart.
Frequently Asked Questions
When should a college football coach go for a fourth down?
Go when the conversion attempt produces more expected value than punting or kicking, given score, time, field position, and personnel. In league-average terms that usually means fourth and inches anywhere on the field, and fourth and four or less inside field goal range. The number changes with a reliable kicker or an excellent punter, which is why the recommendation is a starting point rather than a rule.
Is the fourth-down conversion rate the most important number?
No. Conversion rate is one input, and a high rate can still produce a bad decision if the resulting field position is poor or a failed attempt leaves you in a much worse state. Expected points added, which accounts for where the ball goes in both branches, is a far better guide than conversion rate alone.
When is punting still the analytically favorable choice?
Punting wins in several clear cases: an elite punter with strong coverage, a defense that is strong at field position, a fourth-and-3 or longer in field goal range with a dependable kicker, and any fourth down where converting hands the opponent a short field and failing costs little. Analytics has made punting selective rather than rare.
How do college football win probability models differ from professional models?
College has less public play-by-play, no tracking data at the scale of Next Gen Stats, and far more roster turnover, kicker volatility, and single-game consequences. Most models therefore train on professional data and adjust for college before being used, which is why college recommendations are noisier and why programs rely on pre-built decision charts rather than live models.
If an aggressive fourth-down call works, was it necessarily the right decision?
No, and the reverse matters too. A call can be analytically correct and still fail, because a 55 percent call fails nearly half the time. The only fair way to grade a decision is to look at the win probability going in, which is the framing coaches and analytics executives repeat most often when a go-for-it backfires.
Conclusion
College football analytics turned fourth down from a habit into a comparison. Punt, field goal, or go, each priced in expected points and then win probability, then adjusted for kicker, punter, coverage team, opponent, weather, and clock. The result is fewer default punts, more fourth-down attempts that look reckless on a bad Saturday, and a lot more second-guessing from fans who grade the play instead of the decision.
If you want to evaluate a call yourself before the next game, start with five things: the score, the time, the field position, the conversion odds, and the expected value of both options. Work through the arithmetic rather than the outcome, and remember that a 55% call is supposed to fail a little more often than it succeeds.