Attendance drives college football program revenue through four channels: ticket sales, in-stadium spending on food, parking and merchandise, donations and sponsorship renewals, and the postseason access that follows a full stadium. It also raises game-day costs. Crowds lift gross receipts fastest, but they do not raise net revenue by the same amount.
The figures below come from NCAA financial reports and announced home attendance, mostly fiscal year 2025 filings, with one older 2014 dataset labeled where it appears. The single most useful idea for a reader: announced attendance and bodies in seats are different numbers, and the gap between them is where money quietly disappears.
Table of Contents
- How College Football Attendance Affects Program Revenue at a Glance
- What Is Program Revenue in College Football?
- How Does Attendance Create Direct Ticket Revenue?
- How Do Concessions, Merchandise, and Parking Follow Attendance?
- How Does Attendance Influence Donations and Sponsorships?
- How Does Attendance Affect Media and Postseason Revenue?
- Why Can More Attendance Reduce Net Revenue?
- How Do Stadium Size and Sellouts Change the Result?
- How Can a College Football Program Measure the Financial Impact of Attendance?
- How College Football Attendance Varies Across Games and Seasons
- Frequently Asked Questions
- Does a sellout always mean more ticket revenue?
- How much can one additional attendee contribute to a football game?
- Why can two teams with similar attendance have different program revenue?
- Are ticket donations and complimentary seats counted the same as paid attendance?
- How do bowl games and playoff appearances relate to attendance revenue?
- What Should a Program Do First?
How College Football Attendance Affects Program Revenue at a Glance
Before going channel by channel, it helps to separate three buckets that get lumped together all the time.
| # | Bucket | What it covers | Who keeps the money |
|---|---|---|---|
| 1 | Ticket revenue | Paid attendance multiplied by the realized ticket price, after complimentary tickets, refunds and student and employee allocations | The program, minus taxes and any bowl or conference pass-throughs |
| 2 | Secondary economic activity | Hotels, restaurants, bars and local vendors who sell to fans who travel in | The local economy, not the athletic department |
| 3 | Game-day costs | Staffing, security, concession operations, cleaning, trash, utilities, transportation and guest services | Money out of the same budget that holds bucket one |
Here is the trap. Take a stadium with 50,000 people in the seats. If the average realized ticket price is 60 dollars, that is 3 million dollars of gross ticket receipts. Add per-capita food, parking and merchandise and gross receipts climb higher. Then the game costs money to run: extra gate staff, extra ushers, extra trash hauling, extra security, more power.
So 50,000 attendees reliably raise gross receipts and only sometimes raise net program revenue by a matching amount. Headlines that quote a total economic impact figure are usually quoting bucket two, and the skepticism fans bring to that number is deserved, because most of it never lands in the athletic department budget.
What Is Program Revenue in College Football?
Program revenue is the recurring income tied to football operations: ticket sales, NCAA and conference distributions, sponsorship and licensing, donations, bowl payments, concessions, parking and other institutionally controlled sources.
The scope matters more than the definition. A university’s overall football figure includes institutional money and some allocated support. An athletic department’s total revenue covers every sport on campus. NCAA financial reports also separate football from the rest of the department, so a percentage can be true against one denominator and misleading against the other.
That dual-denominator problem is where most arguments about football money go wrong. Say tickets are 28.9 percent of Alabama’s football revenue and 16 percent of its athletic department revenue. Both numbers come from the same reporting period and describe two different realities.
How Does Attendance Create Direct Ticket Revenue?
The formula is simple: paid attendance times the average realized ticket price. Everything interesting hides in what “realized” means.
Not everyone in the stadium pays cash at the gate. Complimentary tickets go to coaches, staff, donors and returning players. Student season tickets are heavily discounted, often at a small fraction of face value. Employee benefit tickets carry a payroll deduction rather than a cash sale. Some tickets are refunded, some are comped for weather, and some are sold to brokers who mark them up.
None of that makes the headcount wrong, but it does mean announced attendance overstates cash collected. Ohio State’s 2025 home schedule shows the spread plainly, comparing tickets announced against tickets scanned at the gate.
| Opponent | Announced attendance | Scanned at the gate | Gap |
|---|---|---|---|
| Rutgers | 100,023 | 75,746 | 24,277 |
| Grambling State | 100,624 | 81,165 | 19,459 |
| Ohio | 93,731 | not reported separately | n/a |
| UCLA | 89,249 | not reported separately | n/a |
| Texas | 95,995 | not reported separately | n/a |
Ohio State’s stadium capacity is 102,780. Program-specific reporting puts its no-show rate at 10 to 15 percent, against an FBS average often cited near 30 percent. Same games, same team, same price list, very different revenue depending on which column you read.
Game type changes the math too. Home games against lower-tier opponents rely on cheap student pricing and season-ticket holders who already paid. A rivalry game sells at full face value, draws buyers from out of town, and rarely has discounted inventory. A postseason game stacks the full ticket price on top of premium hospitality and a national audience that wants seats.
The dollar effect is concrete. Ohio State reported 81.7 million dollars in football ticket revenue for fiscal year 2025, up from 58.8 million dollars the prior year, inside a department total of 336.1 million dollars. Alabama reported 42.7 million dollars, sixth among public SEC schools.
How Do Concessions, Merchandise, and Parking Follow Attendance?
Per-capita spending is the number that decides how much a body in a seat is actually worth to a program. The table below is an illustrative index, not reported figures, with an average opponent set at 100 so you can see the shape rather than pretend to a precision that does not exist.
| Category | Average opponent (100) | Conference game | Rivalry game | Postseason game |
|---|---|---|---|---|
| Food and beverage | 100 | 165 | 210 | 145 |
| Apparel and merchandise | 100 | 140 | 200 | 175 |
| Parking and gate | 100 | 120 | 130 | 120 |
| Premium and hospitality | 100 | 175 | 240 | 190 |
| Total in-stadium per head | 100 | 152 | 197 | 157 |
Two details decide whether that spending reaches the program. First, gross stadium sales are not program revenue; the venue operator, the concessionaire and in some cases the state fair authority take a cut before anyone reconciles a ledger. Second, a higher-priced menu means fewer purchases per person, so per-head spending does not rise in a straight line with the price of a burger.
Parking is the closest thing to a pure multiplier: more cars means more transactions, and parking usually has low incremental operating cost once the lot and staffing are in place.
How Does Attendance Influence Donations and Sponsorships?
A full stadium is the most reusable sales tool a program owns, and nobody sells it better than the program itself. Sales pitch that industry figures have used for years comes down to one line: attendance drives recruiting, attendance drives donations, merchandise sales.
The mechanism is repeatable. A donor deciding whether to renew a premium seat wants to know the brand is growing, and seat counts are the easiest proof available. A sponsor selling beer or phones needs a crowd to sell to, and often writes attendance targets into the contract itself.
Run the hypothetical. A premium seating block of 2,000 seats at 5,000 dollars each brings 10 million dollars when the season holds up, and the renewal rate drops fastest for the sections closest to the field. Add a sponsorship tier priced against a 90,000-seat sellout and a 70,000-seat crowd, and the sponsor has a legitimate reason to renegotiate.
None of this makes attendance the only input. Winning, coaching changes and facility quality move donations on their own, and plenty of well-attended programs have watched giving soften. Attendance is the visible proof, not the whole cause.
How Does Attendance Affect Media and Postseason Revenue?
Media rights are the largest line in most major football budgets, and they are negotiated by conferences with audiences measured nationally, not by the size of one home crowd. Attendance’s influence here is real but indirect.
The links run through atmosphere and television demand. A stadium that is visibly full produces a broadcast that looks like an event, and the demand for that broadcast feeds the next media cycle. Conference results decide postseason eligibility, and postseason appearance brings distributions that dwarf a single home gate. Revenue sharing, now shaped by name-image-likeness and direct revenue sharing rules, redistributes a slice of football’s return toward players and is drawn from football’s share.
The honest version: national television ratings are not a simple function of home attendance. A packed stadium does not make a team national, and an empty one at an SEC program does not undo a media contract signed years earlier.
Why Can More Attendance Reduce Net Revenue?
Every added body carries a marginal cost. The usual list: event staffing and game-day security, concession and merchandise labor, cleaning and trash, restocking, additional power and water, guest services, shuttle and transit operations, and post-game field and facility work.
Some of those are step costs. Once a stadium needs a second screening lane or a second restroom cleaning crew, the expense does not scale down as attendance falls. That asymmetry is why the biggest cost jump often arrives at a specific occupancy threshold rather than spreading evenly.
Simple break-even. Suppose a program runs 45,000 fans at a 50 dollar realized price, with 25 dollars of in-stadium spend per head and 18 dollars of direct variable game-day cost per head. That is 45,000 times 57 dollars, or about 2.6 million dollars of contribution before fixed costs. Move to 30,000 fans and contribution falls to roughly 1.7 million dollars. The 15,000 empty seats did not save money; they removed roughly 855,000 dollars of net contribution while the fixed game costs stayed put.
How Do Stadium Size and Sellouts Change the Result?
A stadium running well below capacity and a stadium at a true sellout produce very different margins, even at the same ticket price.
In a stadium sitting 20 percent full, the per-seat fixed cost is high and most of the building’s cost structure is already committed. Marginally, adding fans is cheap because the gates and staffing are open anyway. Near a sellout, the cheap seats are gone, pricing power shifts to premium inventory, and every additional seat requires adding rows, re-staffing a section or opening a closed gate.
Capacity percentage is therefore a misleading headline metric on its own. One program can report 98 percent of a 30,000-seat building and one can report 68 percent of a 102,780-seat building, and the second program sold more actual tickets.
That is the paradox some athletic departments run into when they trim seating to raise per-capita ancillary spend: fewer seats, fuller building, better average spend per attendee, lower total headcount. Whether that trade is right depends entirely on whether the program needs the volume or the yield.
How Can a College Football Program Measure the Financial Impact of Attendance?
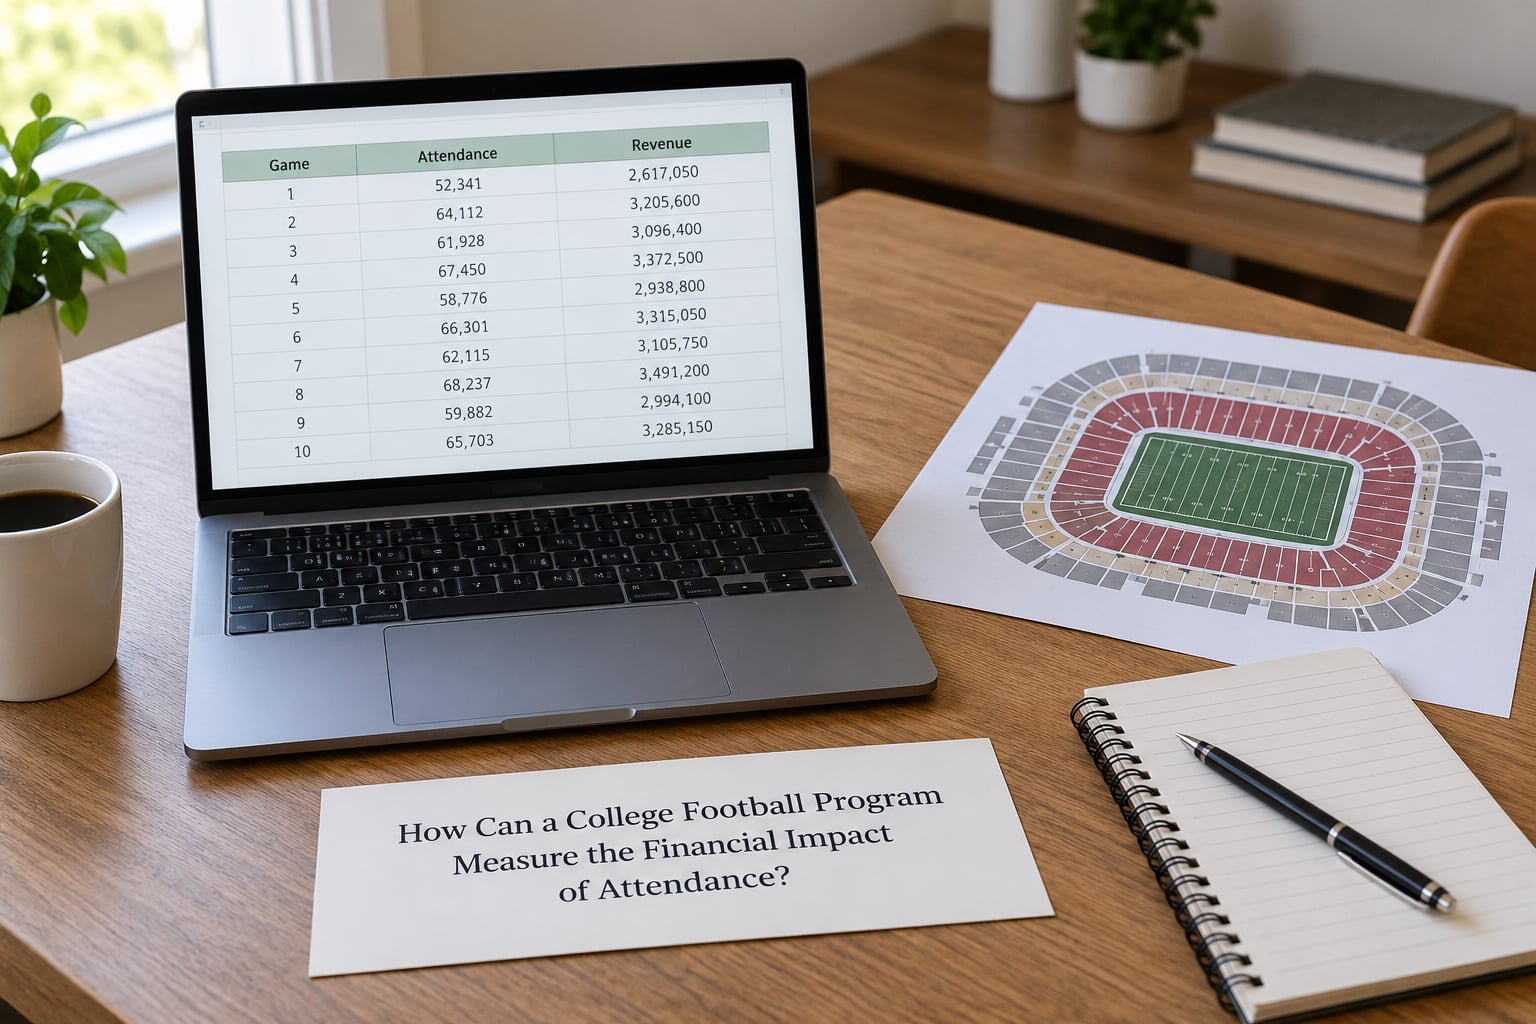
Most programs can build this picture from data they already collect. Six metrics cover it.
- Paid attendance per game, taken from ticketing scans rather than the announced figure.
- Average realized ticket yield, calculated on cash collected after comps, discounts and refunds.
- Per-capita concession, merchandise and parking sales per person in the building.
- Sponsorship and premium seating value tied to attendance commitments.
- Direct game-day costs for that specific game, including incremental staffing and overtime.
- Net contribution per game: direct revenue minus direct cost, with fixed costs tracked separately.
How college football attendance affects program revenue, line by line
Run the same six metrics on a rivalry game and a non-conference game and the difference usually runs 50 to 100 percent of total contribution per game, even when the headcount gap is smaller than fans expect. That spread is why scheduling decisions get argued about as if they were financial decisions, because at some level they are.
Most of these numbers exist but live in different systems. Ticketing holds the scans, the ticket office holds the yield, finance holds revenue and expense lines, athletics holds the schedule and the donor file, and stadium operations holds staffing and event costs. Reconciling them per game, not per season, is the whole job.
The source data is public. Schools file annual financial reports with the NCAA, and those reports are searchable in the NCAA Finances database by fiscal year and institution. Pull a school’s ticket revenue line, pull its total football revenue, pull its department total, and you have reproduced the reliance percentages in this article yourself.
How College Football Attendance Varies Across Games and Seasons
Average home attendance hides the spread that actually drives the budget. A mid-tier non-conference opponent in October, a rivalry game in November and a postseason game in January are three different businesses.
| Game type | Typical attendance | Realized ticket price | Per-capita in-stadium spend | Net contribution per game |
|---|---|---|---|---|
| Lower-tier non-conference home game | Low | Heavily discounted, student-weighted | Below average | Low or negative after fixed costs |
| Conference home game | Mid to high | Mixed, season and single-game | Above average | Positive |
| Rivalry game | High | Full face value | Highest of the regular season | Strongest regular-season result |
| Conference championship or postseason | Sellout or near | Premium and hospitality priced | High, with a broader regional buyer | Best single-game result, plus distributions |
The usual swing factors: opponent quality, kickoff time, weather, TV window, team record going in, and how many marquee non-conference games remain on the schedule. The point fan conversation keeps landing on is simple: a schedule with fewer rivalry games produces the same empty upper deck that a bad team produces, just more slowly.
Weather and start time are the cheapest levers and the least used. A late-afternoon kickoff in November costs more seats than a season of ticket-price changes can recover.
On the trend question, be careful with dates. One widely cited figure says ticket sales and donations together were 41 percent of Football Bowl Subdivision revenue in 2014, from a 2015 NCAA report. The long-form coverage explaining why attendance has slipped, including the student-to-alumni conversion problem, also dates from 2017. Both are useful for causes and neither is a current read on the trend. For a current number, pull the last two fiscal years of attendance and gate scans and compare them yourself.
Frequently Asked Questions
Does a sellout always mean more ticket revenue?
No. A sellout describes seats filled, not cash collected. Complimentary tickets, heavily discounted student allocations and employee benefit tickets can fill a building without generating real revenue, and the seat count depends on how many seats the school decided to keep open. A stadium trimmed to 30,000 and sold out can produce less ticket revenue than a 102,780-seat stadium that is two thirds full.
How much can one additional attendee contribute to a football game?
Work it out in three steps. Add the realized ticket price, which is cash collected after comps and discounts. Add per-head spending on food, parking and merchandise, then subtract the share that goes to the venue operator or concessionaire rather than the program. Subtract the direct game-day cost of serving that person, such as a share of staffing, cleaning and utilities. The result varies widely by game type.
Why can two teams with similar attendance have different program revenue?
Because attendance is an input, not a total. Ticket pricing, season-ticket mix, student discount rates, the share of in-stadium spending the program keeps, media distributions, donations and bowl access all differ. SEC figures show the spread: tickets were 53 percent of football revenue at one school and 24.1 percent at another in the same fiscal year.
Are ticket donations and complimentary seats counted the same as paid attendance?
No. Complimentary and donated tickets appear in the announced attendance figure because a person occupies the seat, but they generate little or no ticket cash. The distinction shows up in NCAA financial reporting, where revenue and attendance are disclosed separately. That gap is why programs are judged on paid attendance and gate scans when the question is revenue.
How do bowl games and playoff appearances relate to attendance revenue?
A postseason appearance is the highest-value single game a program plays, with full-price inventory, premium hospitality and a regional buyer base that extends beyond season-ticket holders. On top of the gate, the appearance brings an institutional distribution from the bowl organization or playoff. The cost side is real too: extra staffing, longer operating hours and post-event facility work.
What Should a Program Do First?
Start with net contribution per game, computed from paid attendance, realized ticket price, per-capita in-stadium spend and direct game-day costs. Once that number exists for every game on the schedule, the argument stops being about whether attendance matters and starts being about which games, prices and capacities to build around.
Attendance is the biggest lever most programs pull. It is not the profit.